Market News
Week ahead: Q1 earnings, inflation data, Fed chairman testimony among key factors to watch
.png)
7 min read | Updated on July 08, 2024, 09:03 IST
SUMMARY
The current structure of the NIFTY50 index remains positive, with immediate support of around 24,100. A close above 24,400 will signal the resumption of an uptrend. Until then, the index may consolidate in this range.

Stock market week ahead: Q1 earnings, Inflation data to be announced this week
Markets extended their winning streak for the fifth consecutive week, closing above the previous week's high. The sharp move in the indices was led by positive global cues and foreign institutional Investor (FII) inflows.
Sectorally, barring PSU Banks (-0.1%), all the other indices ended the week in green. IT (+4.3%) and Pharma (+3.6% ) advanced the most.
The broader markets closed at a record high, extending the momentum of the rally to the fifth week in a row. The NIFTY Midcap 100 index rose 2.4%, while the Smallcap 100 index was up 3.4%.
Index breadth- NIFTY50
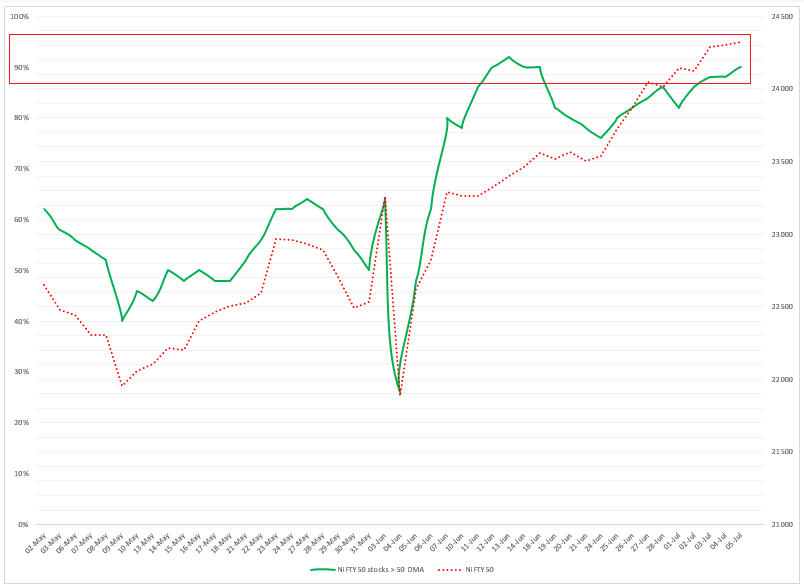
The NIFTY50 index continued its bullish momentum from last week, with over 80% of the NIFTY50 stocks trading above their 50-day moving average (DMA). In our analysis last week, we informed our readers that the broader trend remains positive and that we remain cautious on the higher side.
Currently, 90% of the NIFTY50 stocks are trading above their respective 50-day moving average (DMA), indicating strength at higher levels. However, as you can see in the chart below, the breadth indicator (NIFTY50 stocks trading above the 50 DMA) is close to last week's peak of 92%. In such a scenario, traders should continue to be cautious about profit-booking at higher levels.
FIIs positioning in the index
The Foreign Institutional Investors (FIIs) maintained their net long open interest (OI) in the index futures throughout the week. They increased the net OI to 3.84 lakh contracts, up 11% from last week. The current long-to-short ratio of FIIs in the index futures OI stands at 84:16. As you see in the chart below, the current long contracts OI has reached a slightly overbought zone.
Going forward, traders should monitor the addition in the OI of short contracts and the unwinding of long contracts. If the net OI sustains at the current level of long contracts, we can see a further up move. In the event of unwinding, the index may become range-bound with sharp bouts of volatility.
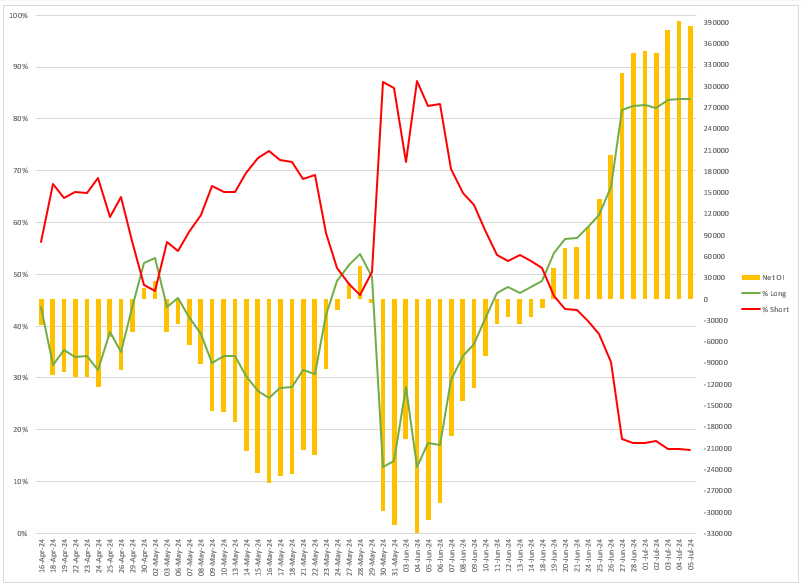
Meanwhile, the cash market activity of the FIIs remained in line with their futures positioning. The FIIs remained net buyers for the fourth week in a row, buying shares worth ₹6,874 crore. On the other hand, Domestic Institutional Investors turned net sellers and sold shares worth ₹384 crore.
F&O - NIFTY50 outlook
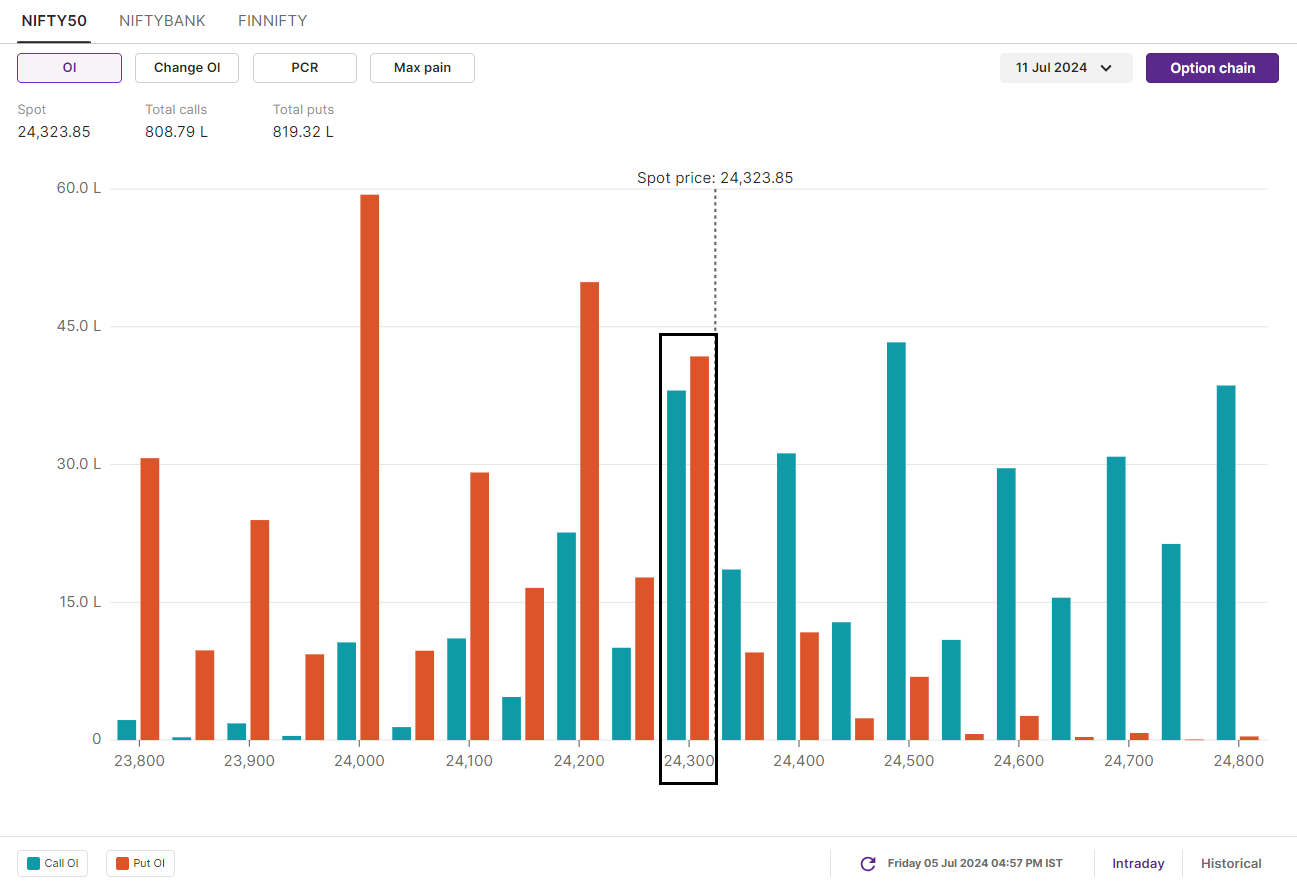
The open interest data for the 11 July expiry reveals significant activity at key strike prices. The 24,500 level shows a large concentration of call options, indicating resistance for traders around this level. Conversely, the 24,000 level has a significant number of put options, suggesting it as a support level. Additionally, the 24,300 strike has notable open interest for both calls and puts, pointing to a range-bound activity around this level.
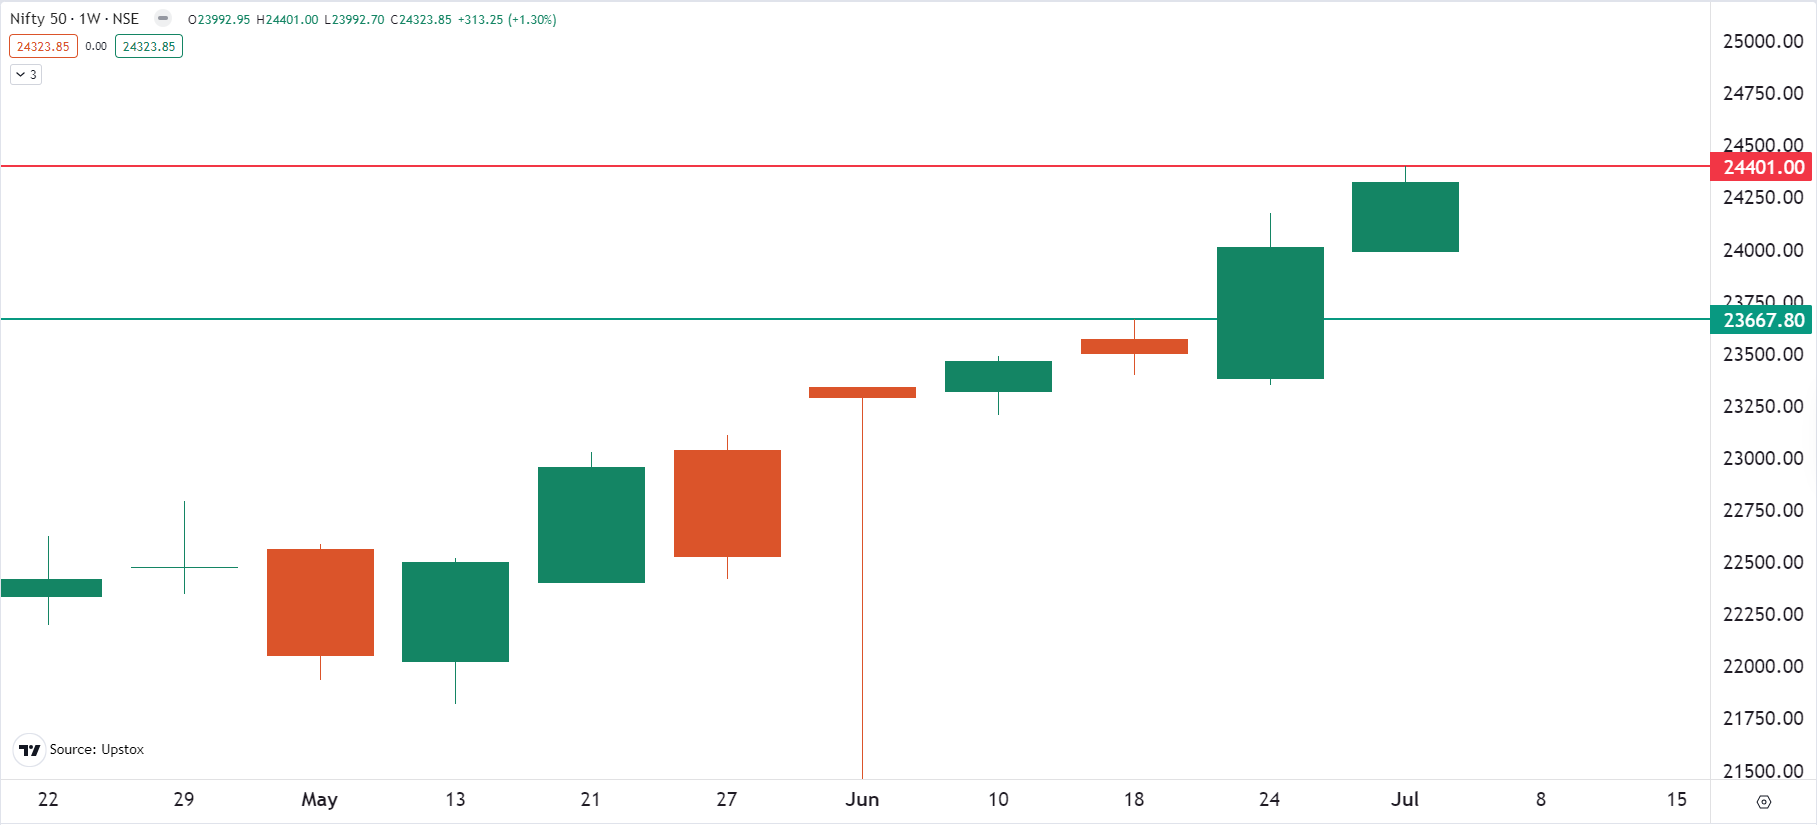
On the weekly chart, the NIFTY50 index has formed a bullish candle, closing above the previous week’s high. This indicates strong buyer dominance at lower levels. For this week, the index has crucial support around 23,700 zones. After nearly a 4% rally in the last two weeks, the risk-reward for the fresh long positions remains unfavourable in NIFTY50. However, traders should monitor the price action on potential retracements towards the 24,200 and 24,000 zones to plan their strategies.
F&O - BANK NIFTY outlook
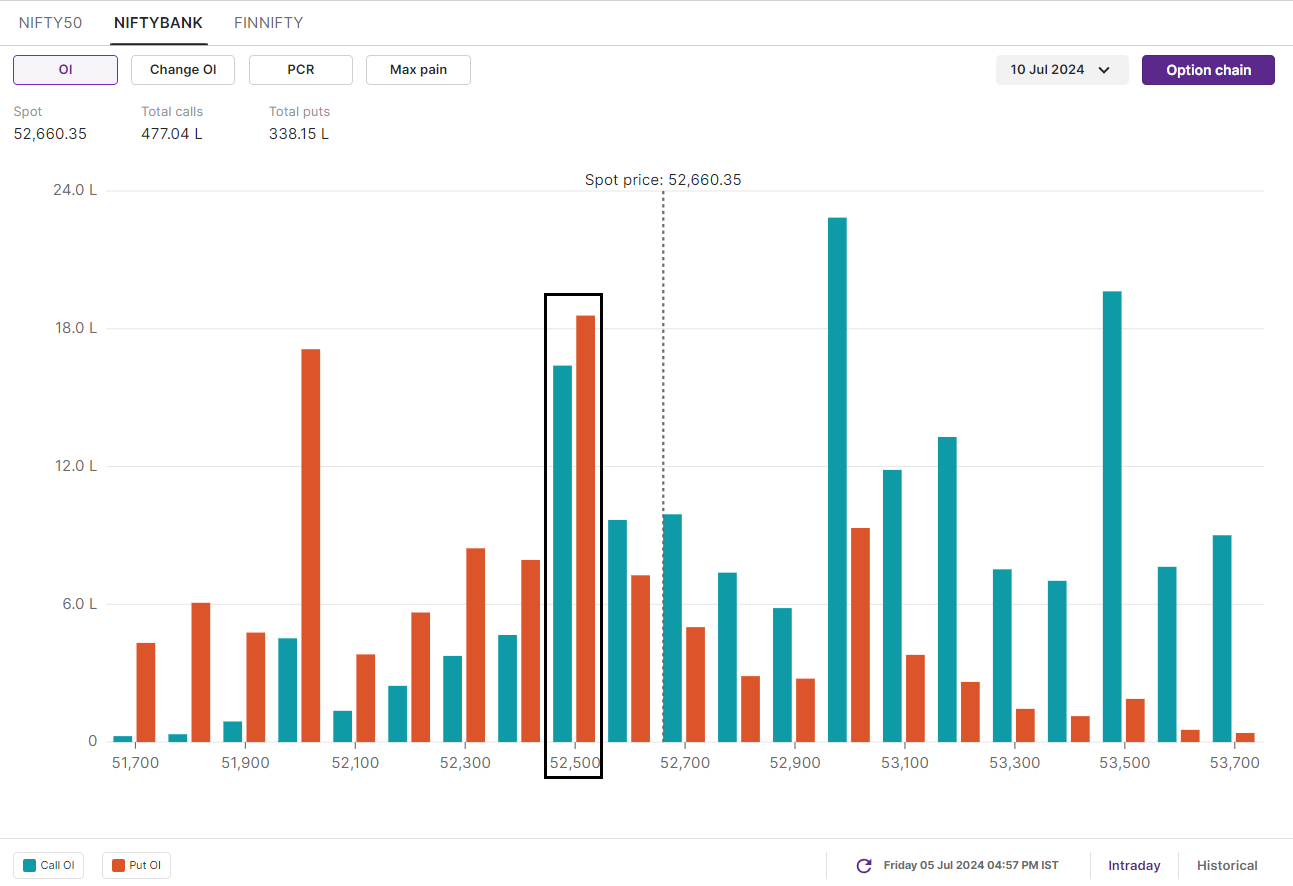
The open interest (OI) data for the 10 July expiry of BANK NIFTY reveals the highest call open interest at 53,000 strike, suggesting resistance around this level. Meanwhile, the largest put base at 52,500 and 52,000, signifies support around these zones. Furthermore, significant OI in both call and put options at the 52,500 strike points to range-bound activity.
On the weekly chart, the BANK NIFTY failed to close above the previous week’s high, facing rejection around the 53,000 mark. As shown in the chart below, the BANK NIFTY has formed a doji candlestick pattern near its record high, signalling indecision among investors. In the upcoming sessions, traders should keep monitoring the break of the high and low of this candle. A close above or below the doji’s high or low on the daily chart will provide directional clues. Until then, the index may oscillate within this range.
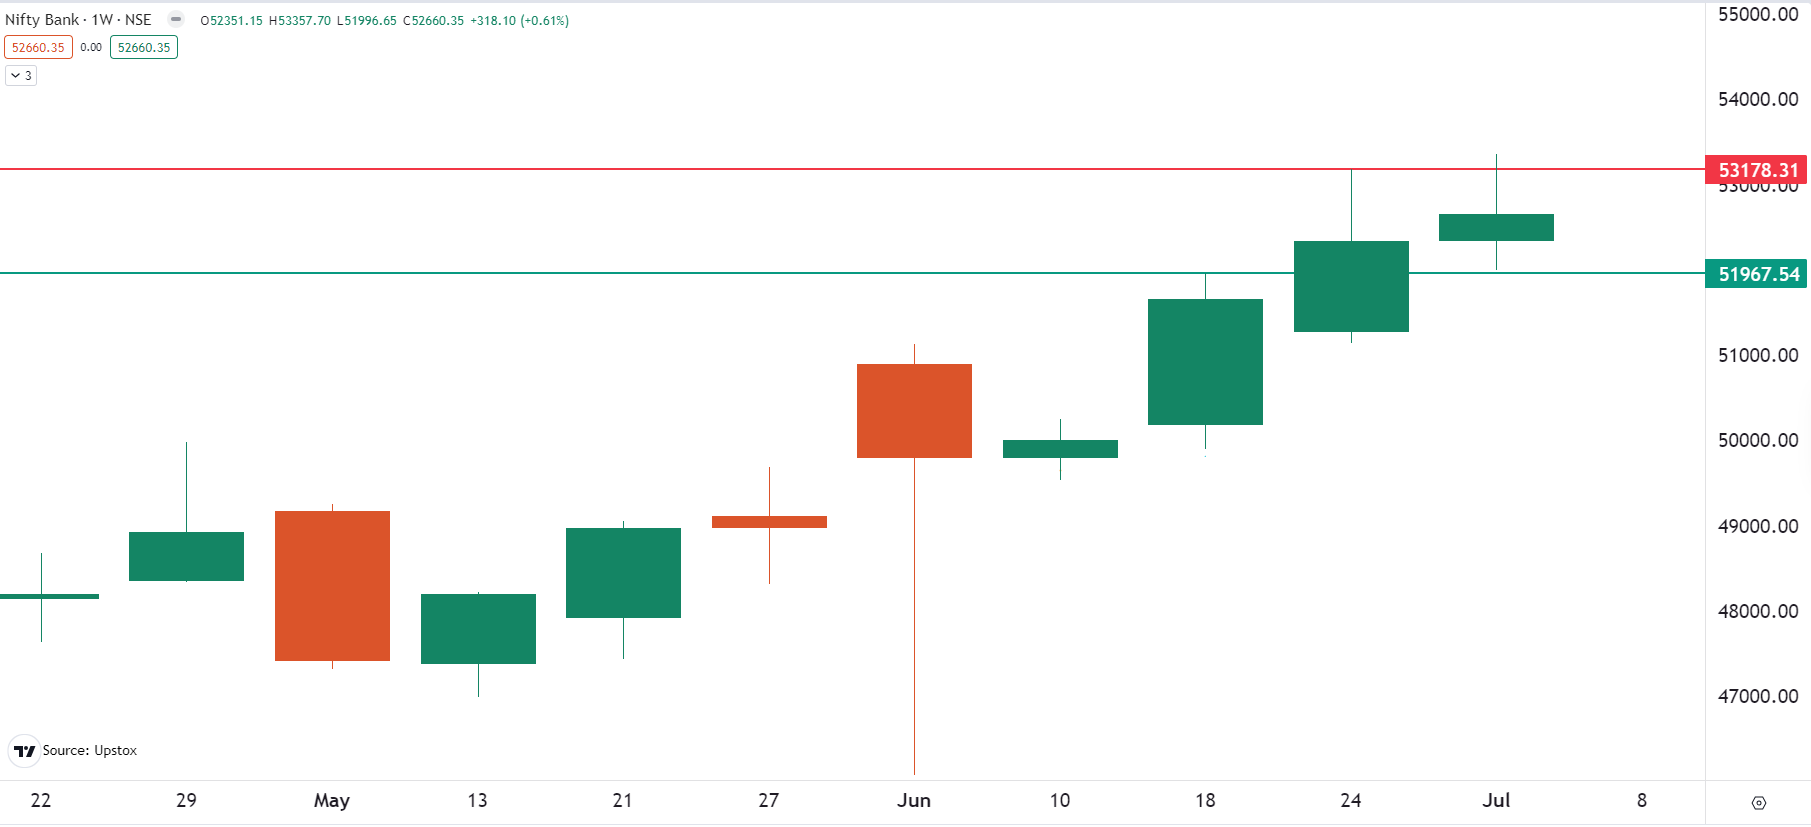
This week, after closing at record highs, both indices are again sending mixed signals. The BANK NIFTY has encountered resistance around the 53,000 level, indicating the presence of sellers. The index will resume its uptrend if it breaks above this level on a closing basis.
Meanwhile, with a close above previous week’s high, the NIFTY50 index has shown no sign of sellers at higher levels. However, the the index has rallied over 4% from last week’s low and encountered a minor hurdle around the 24,400 mark. A close abve this level will signal resumption of the uptrend, while weakness will emerge if index closes below 24,100 on the daily chart.
To stay updated on any changes in these levels and all intraday developments, be sure to check out our daily morning trade setup blog, available before the market opens at 8am.
About The Author
Next Story

