Market News
Week Ahead: Inflation, tariff wars and FII trends among key triggers to watch out
.png)
6 min read | Updated on March 10, 2025, 07:23 IST


SUMMARY
In a holiday-shortened week, market trends will be driven by inflation data, Trump's tariff policy and foreign fund outflows. In the meantime, traders can monitor the price action of the NIFTY50 index around the key resistance zone of 22,700-22,800. A close above or rejection from the zone will provide further directional insight.

FIIs continued their selling streak, offloading ₹15,501 crore worth of equities in the cash market so far this month. | Image: Shutterstock
Markets staged a recovery last week, with the NIFTY50 index snapping a three-week losing streak to close nearly 2% higher. The recovery came despite weak global cues and concerns over tariff wars of the U.S. with multiple trading partners.
The rally was fueled by a combination of positive factors like decline in the dollar index, and the Reserve Bank of India's liquidity infusion. These factors helped bolster investor confidence and drive the markets higher.
All major sectoral indices closed the week in positive territory, with Metals (+8.6%) and Energy (+5.9%) leading the gains. Meanwhile, the NIFTY Midcap 100 and Smallcap 100 indices also staged a strong rebound, rising between 2% and 5%.
Index breadth
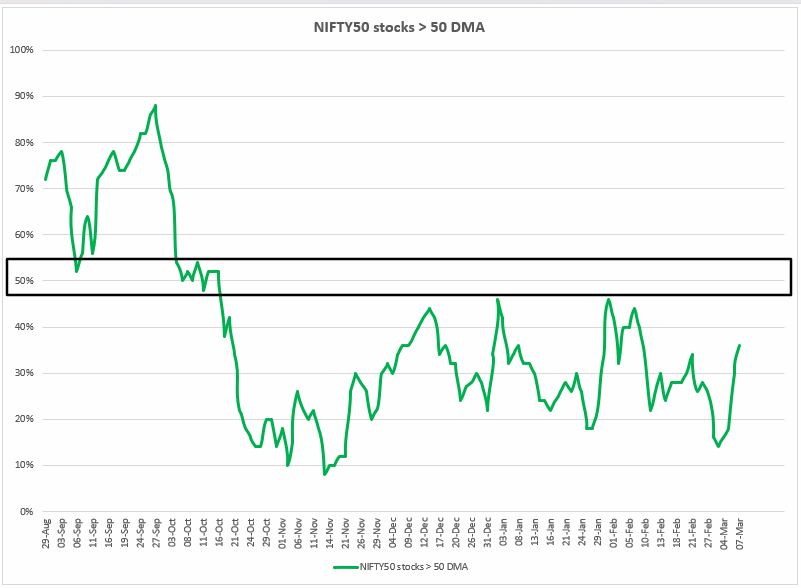
The breadth of the NIFTY50 index showed slight improvement in the last two sessions, rising above 30%. However, it remains below the critical 50% threshold, indicating that overall market strength is still lacking. The indicator has stayed below the 50% mark for over five months.
Last week, the average 23% of NIFTY50 stocks were trading above their 50-day moving average (DMA), reflecting persistent weakness. Historically, when this indicator drops to around 10%, the index has experienced short-term bounces from oversold levels.
FIIs positioning in the index
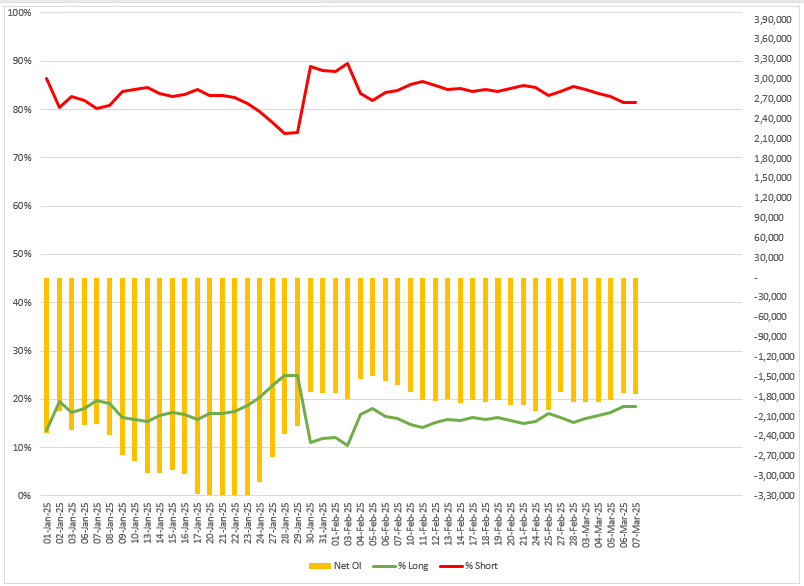
Foreign Institutional Investors (FIIs) continue to sustain their bearish outlook on Indian equities, as they maintained their short positions in index futures. They kicked off the March series with a heavily skewed long-to-short ratio of 15:85, and have trimmed marginally to 18:82, indicating bearish bias. Net open interest in futures contracts remains in negative territory, exceeding -1.7 lakh contracts.
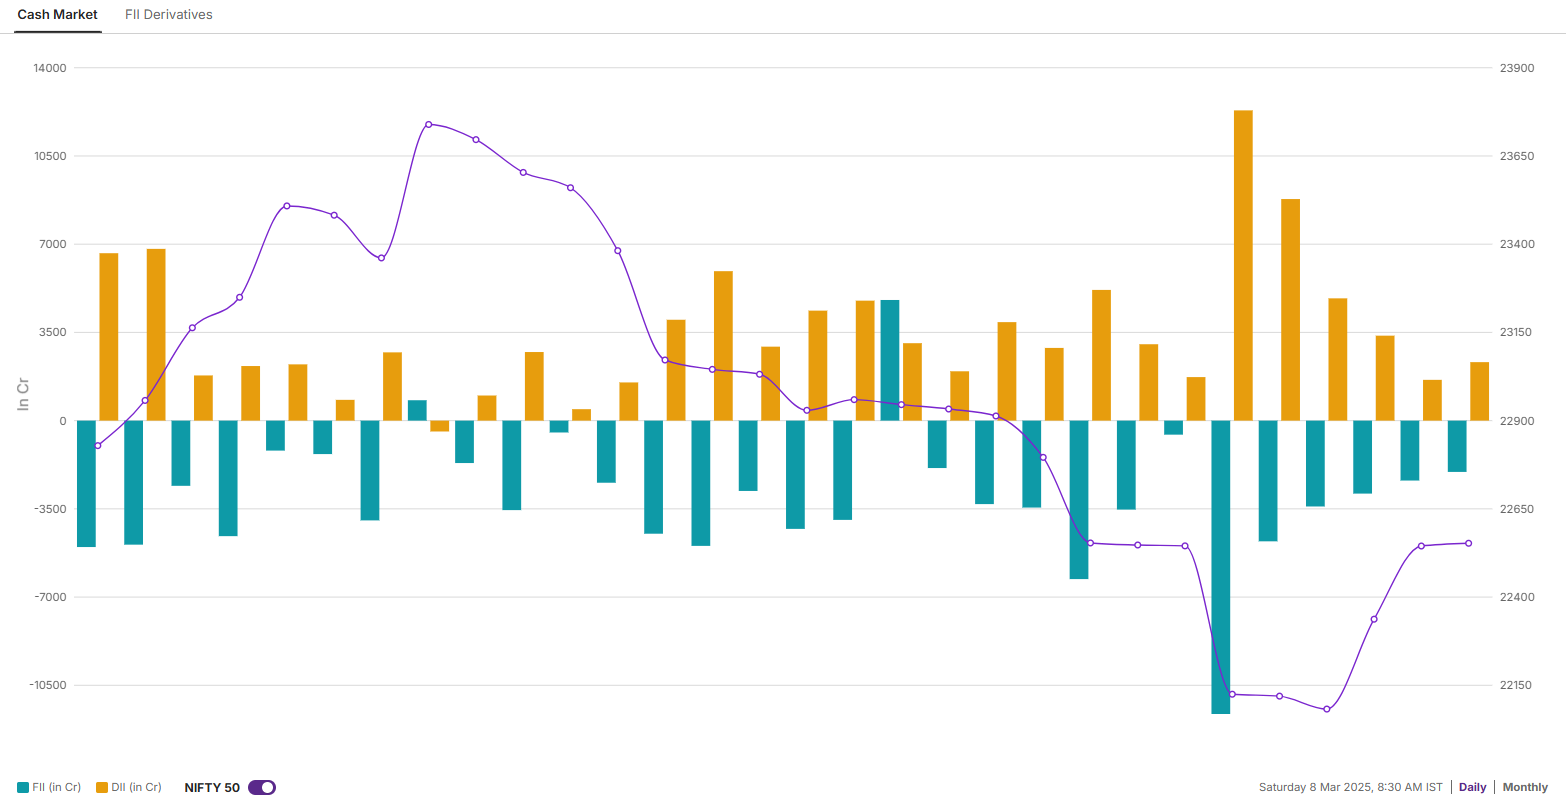
Meanwhile, Foreign Institutional Investors (FIIs) continued their selling streak, offloading ₹15,501 crore worth of equities in the cash market. However, Domestic Institutional Investors (DIIs) absorbed the selling pressure, stepping in with ₹20,945 crore in equity purchases.
NIFTY50 outlook
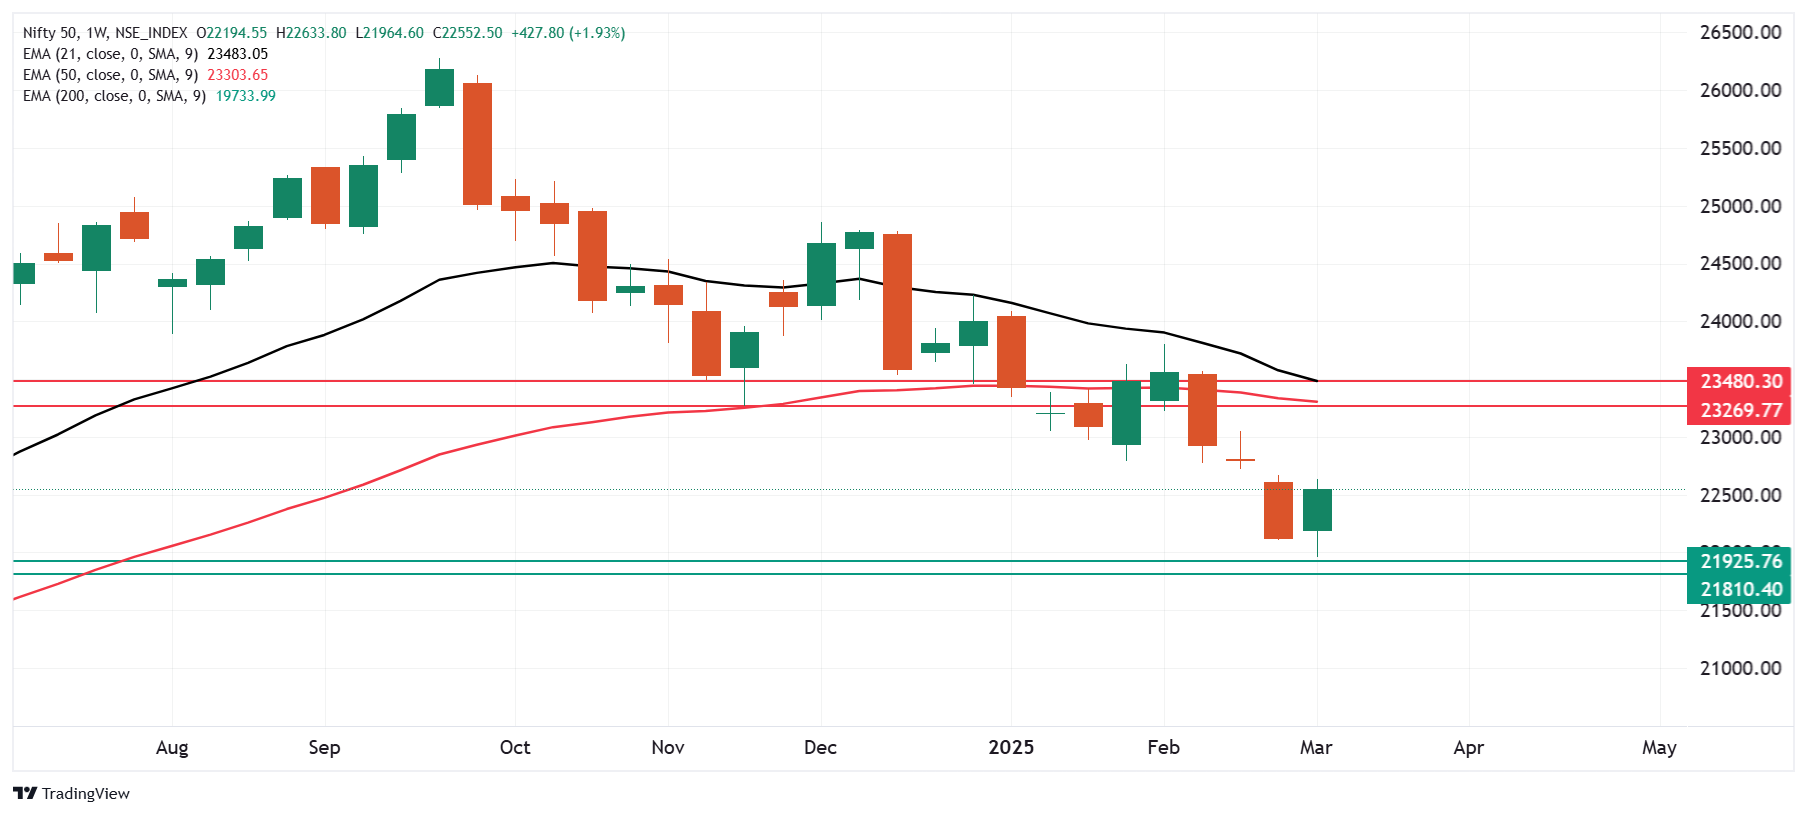
The NIFTY50 broke its three-week losing streak to post gains of almost 2% and form a green candle on the weekly chart, resembling a hammer candlestick pattern - albeit not a textbook one.
In the coming sessions, the index faces immediate resistance in the 23,200-23,500 area. A decisive close above this area could shift the momentum in favour of the bulls. Conversely, key support is at 21,800 - a break below this level could trigger renewed selling pressure. Until a breakout occurs on either side, the index is likely to trade within this range.
SENSEX outlook
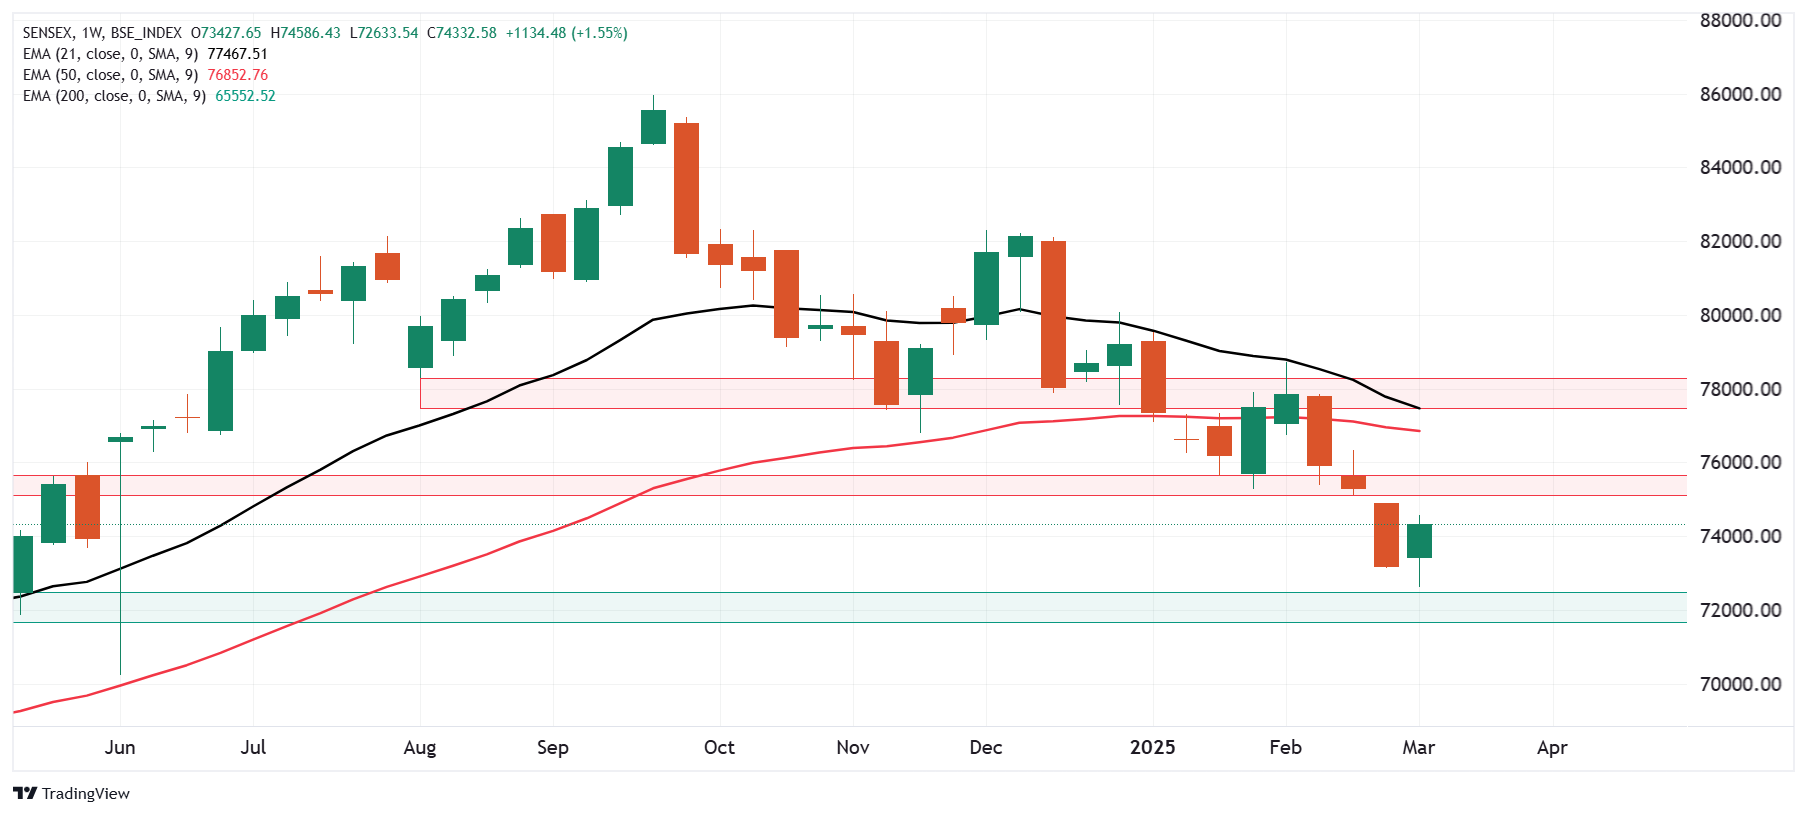
The SENSEX broke its three-week losing streak, gaining over 1% last week. The index rebounded from the critical 72,500 support zone, forming a green candle on the weekly chart that resembles a hammer candlestick pattern, though not a classical one.
Despite this recovery, the broader trend remains weak, as the index continues to trade below its 21-week and 50-week exponential moving averages (EMA). A sustained move above the 50-week EMA (76,850) is essential to signal a trend reversal. On the downside, 72,500 remains a key support level—a decisive close below this zone could trigger further weakness.
On the domestic front, February's inflation report is set for release on Wednesday. In January, retail inflation dropped to 4.3% from 5.2% in December. With prices easing, investors and policymakers will be watching closely to see if this trend continues, offering insights into the RBI’s next move on monetary policy.
Looking ahead, the index faces its next hurdle in the 22,700-22,800 zone, aligning with the 21-EMA. A decisive close above this level could pave the way for a move toward 23,000. Conversely, a break below 21,900 on a closing basis would signal weakness. Until then, the index is likely to trade between 22,200 and 22,800, awaiting a breakout in either direction.
For intraday range updates and revisions to these levels, visit our daily morning trade setup blog, published at 8 AM before the market opens.
Disclaimer:
Derivatives trading must be done only by traders who fully understand the risks associated with them and strictly apply risk mechanisms like stop-losses. The information is only for consumption by the client, and such material should not be redistributed. We do not recommend any particular stock, securities, or trading strategies. The securities quoted are exemplary and not recommendatory. The stock names mentioned in this article are purely to show how to do analysis. Make your own decision before investing.
About The Author
Next Story


