Market News
Trade Setup for Sept 5: NIFTY50 eyes range-bound movement with 25,000 as support
.png)
5 min read | Updated on September 05, 2024, 08:18 IST
SUMMARY
The NIFTY50 index has immediate resistance at the 25,300 level, while support is seen at the 25,100 level. Traders can monitor this range with a base around the 25,200 level. If the index breaches this range with a strong candle, traders may get a directional signal.
Stock list
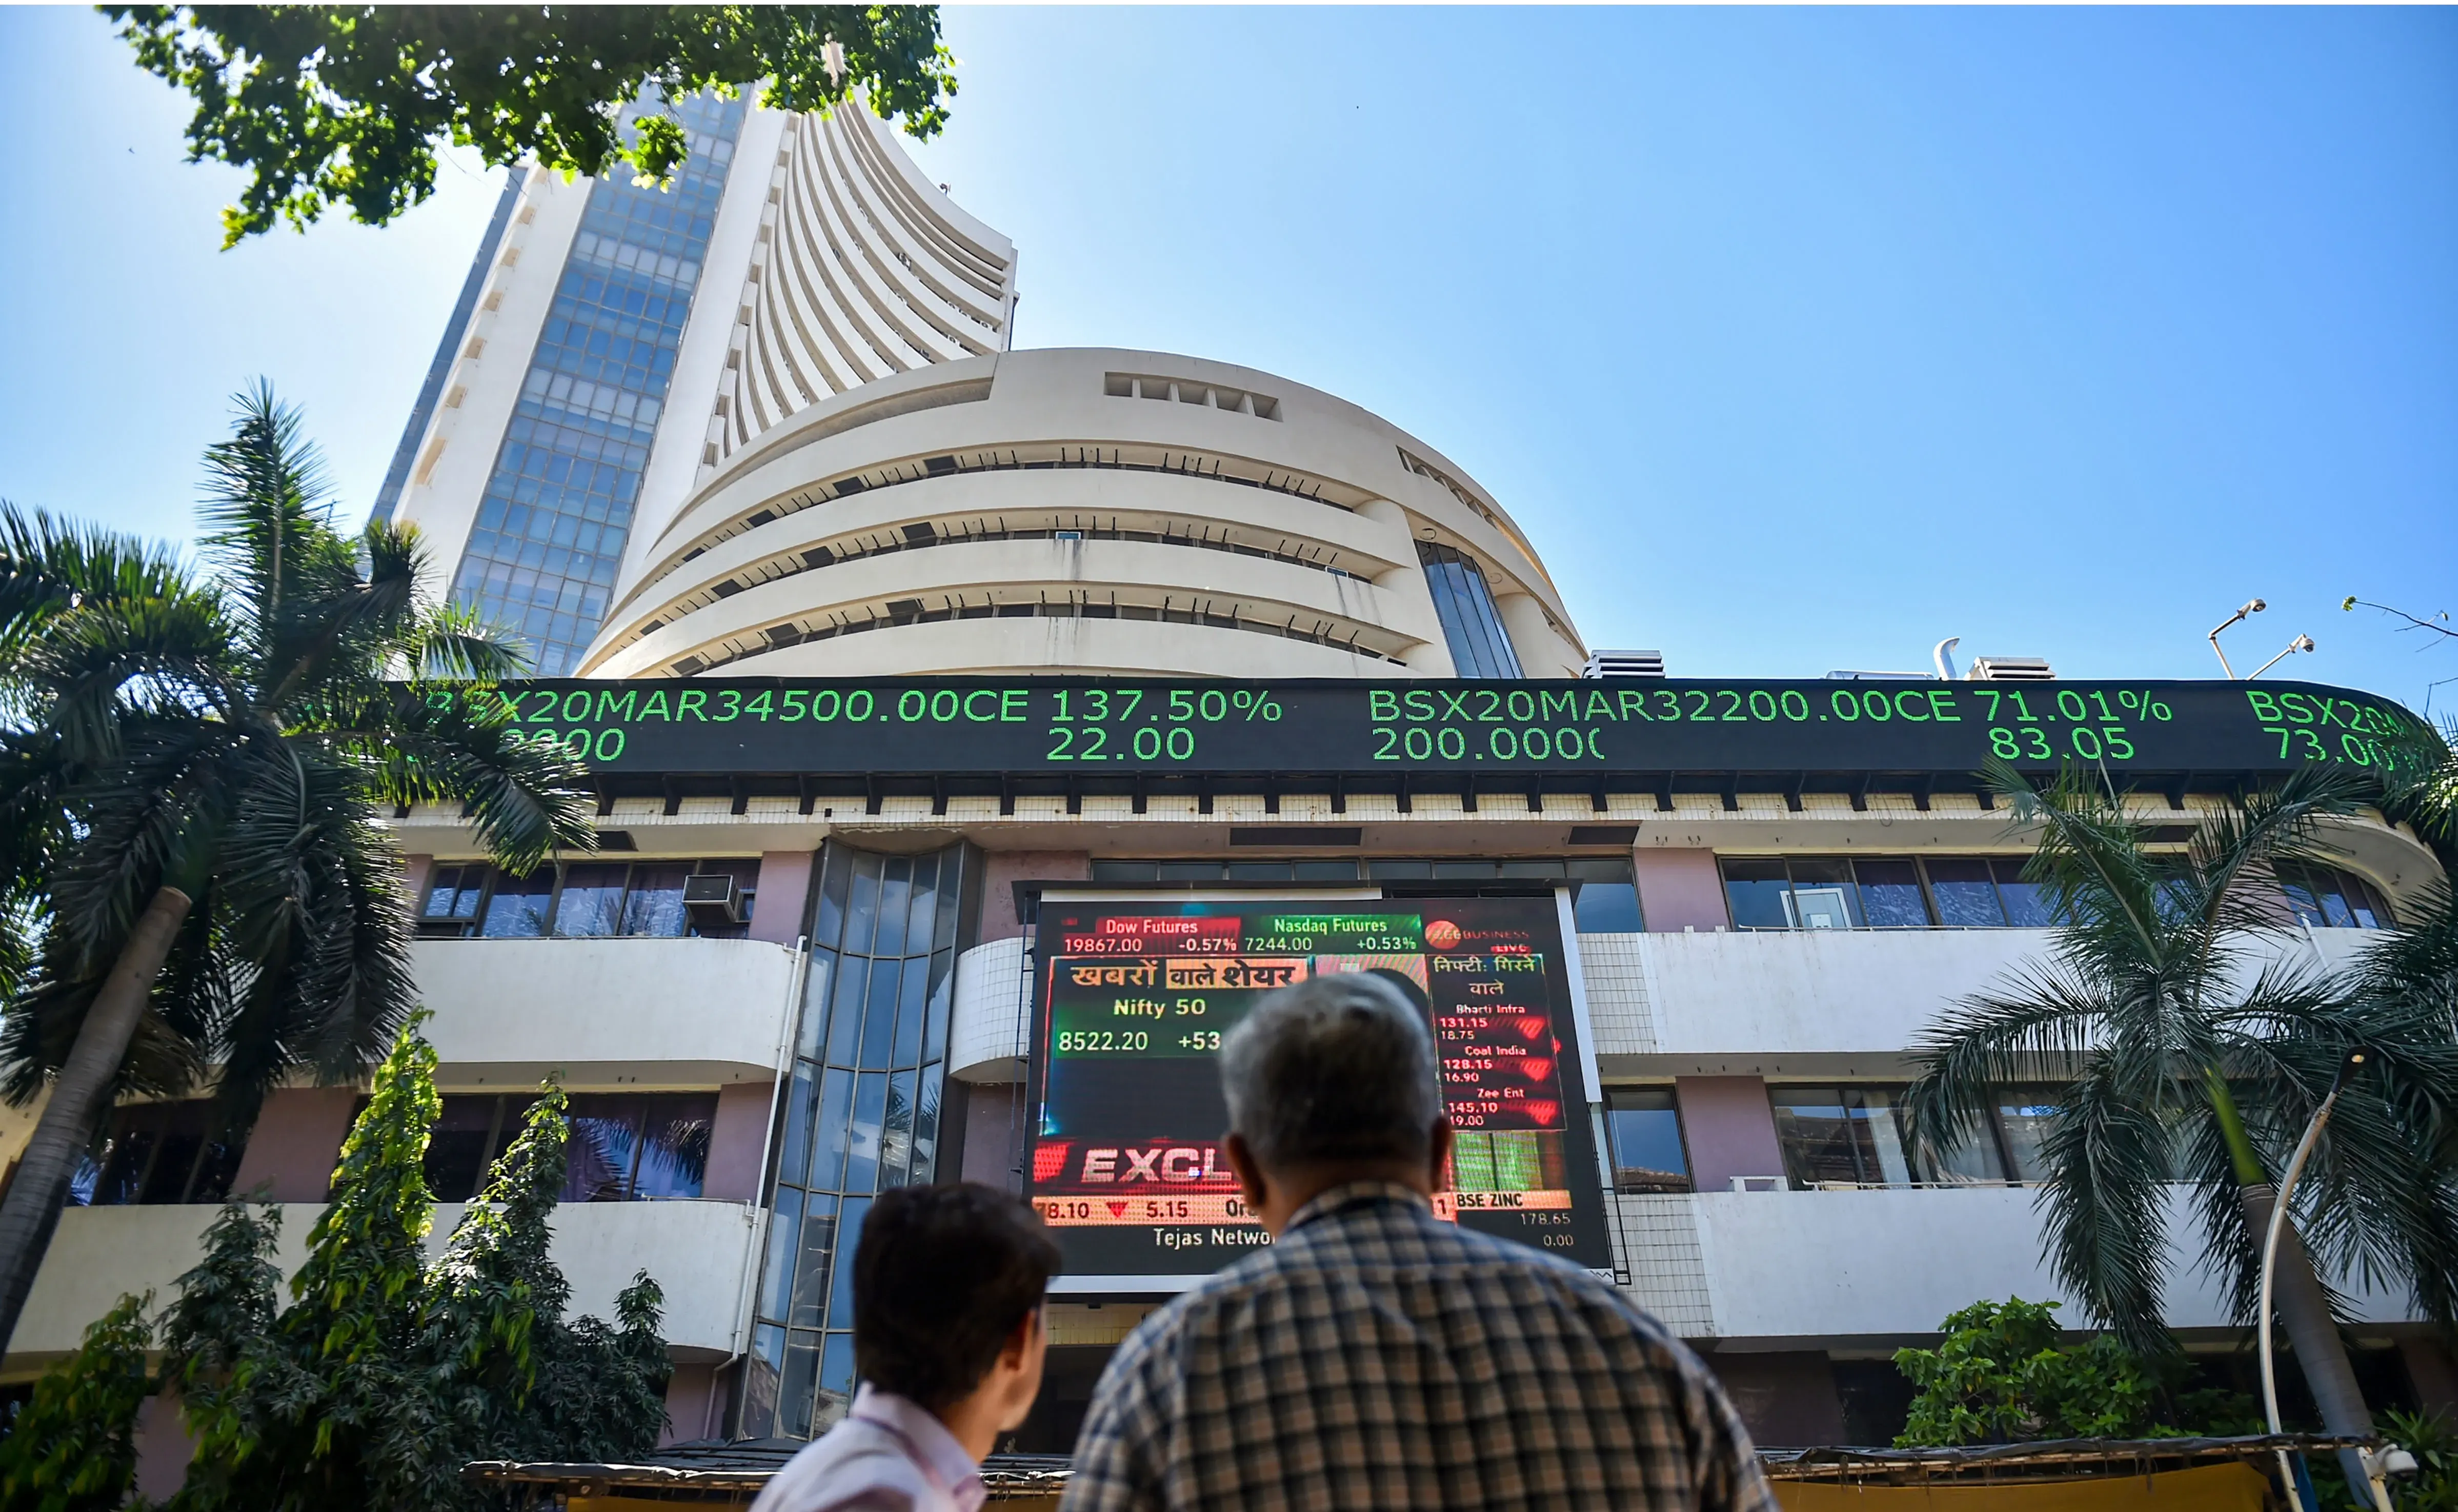
The NIFTY50 index snapped its 14-day winning streak and ended Wednesday's session in the red as weak global cues led to a sell-off in U.S. technology stocks.
Asian markets update at 7 am
The GIFT NIFTY has risen by 0.4%, signaling a likely positive opening for the NIFTY50 as it approaches the expiry of its weekly options contracts. Meanwhile, Asian markets present a mixed picture. Japan’s Nikkei 225 has slipped slightly by 0.1%, while Hong Kong’s Hang Seng index is showing modest gains, up 0.2%
U.S. market update
- Dow Jones: 40,974 (▲0.0%)
- S&P 500: 5,520 (▼0.1%)
- Nasdaq Composite: 17,084 (▼0.3%)
U.S. indices ended Wednesday's session mixed, with the S&P 500 and Nasdaq Composite closing in the red for the second day in a row. Meanwhile, chipmaker Nvidia fell another 1.7% following news that the U.S. justice department had sent subpoenas to the chipmaker.
However, stocks rebounded from the day's lows after the Treasury yield curve briefly inverted. The yield on the 2-year Treasury note closed at a 1-year low of 3.769%, while the yield on the 10-year Treasury note closed at 3.768%, also a 1-year low. The curve has been inverted for some time, with the 10-year note lower than the 2-year note, a common recession signal.
Meanwhile, the market is now pricing in a 48% probability of a 0.5% rate cut at the Fed's September meeting, according to Fed Funds Futures, up from 38% a day earlier.
NIFTY50
- September Futures: 25,247 (▼0.4%)
- Open Interest: 6,09,600 (▲1.2%)
The NIFTY50 index snapped its 14-day winning streak and ended Wednesday's session in the red as weak global cues led to a sell-off in U.S. technology stocks. However, despite the gap down start, the index made a strong recovery from the day's low and protected our below highlighted support zone of 25,150 and 25,200 on a closing basis.
On the daily chart, the broader view remains positive as the index is still trading above its key support zone and fresh buyers have emerged at lower levels. Positionally, the broader view remains positive until the NIFTY50 falls below 25,000 on a closing basis.
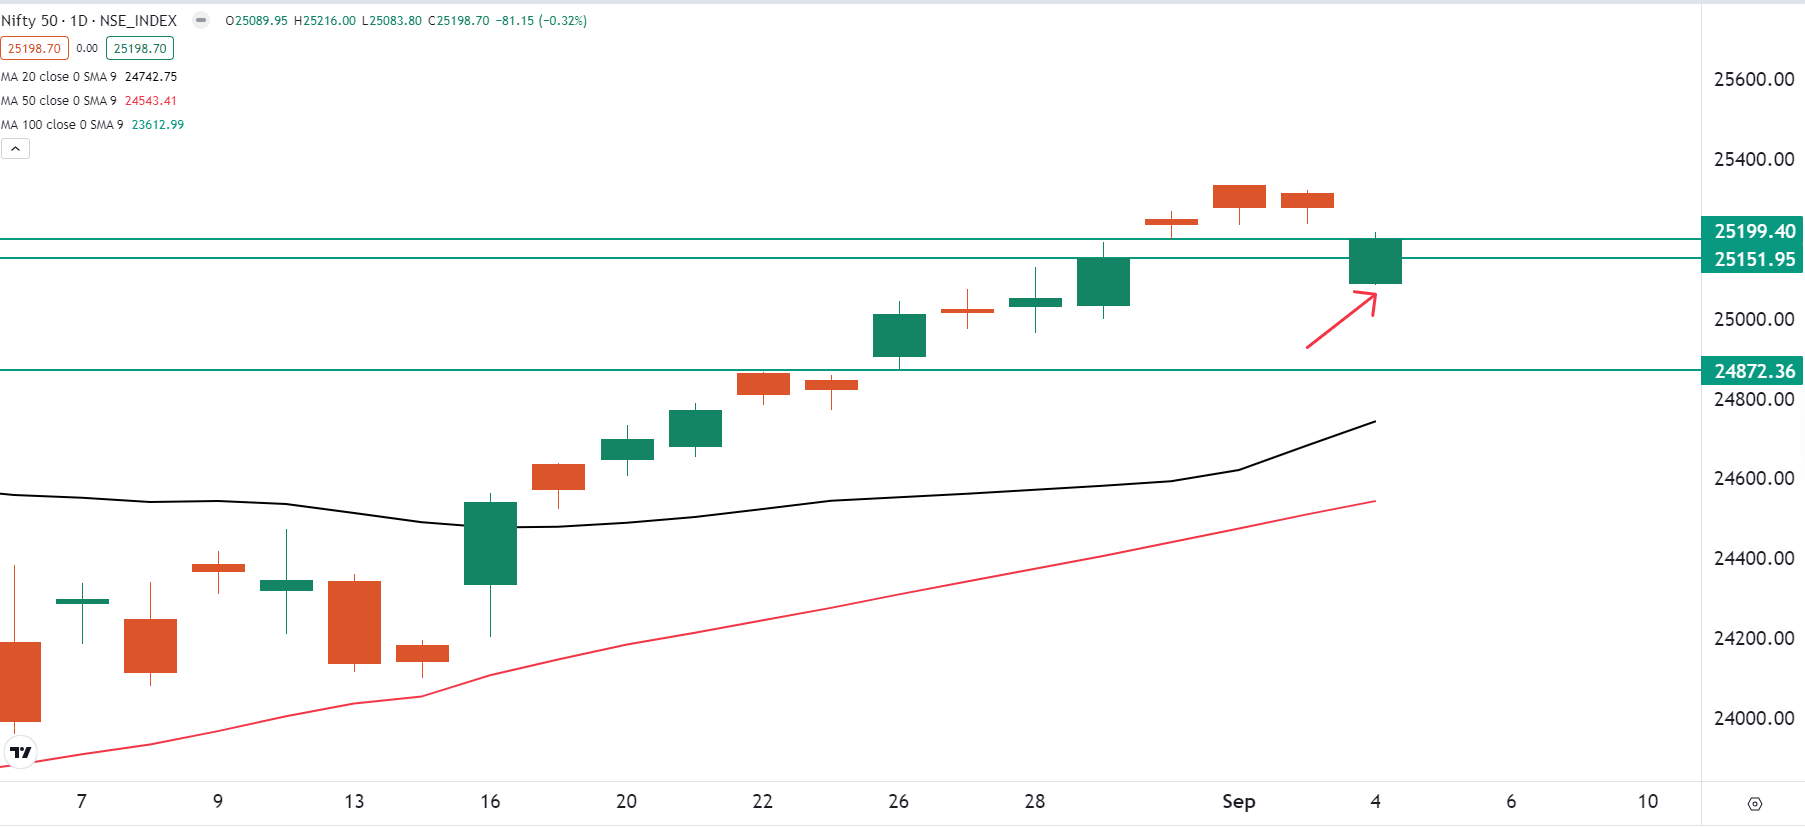
In the shorter time frame (15 minutes), the NIFTY50 shows immediate resistance at the 25,300 level, while support is seen at the 25,100 level. Traders can monitor the range highlighted below for today's expiry with a base around the 25,200 level. If the index breaches this range with a strong candle on the 15-minute chart and holds for 15 minutes, traders may witness a directional move.
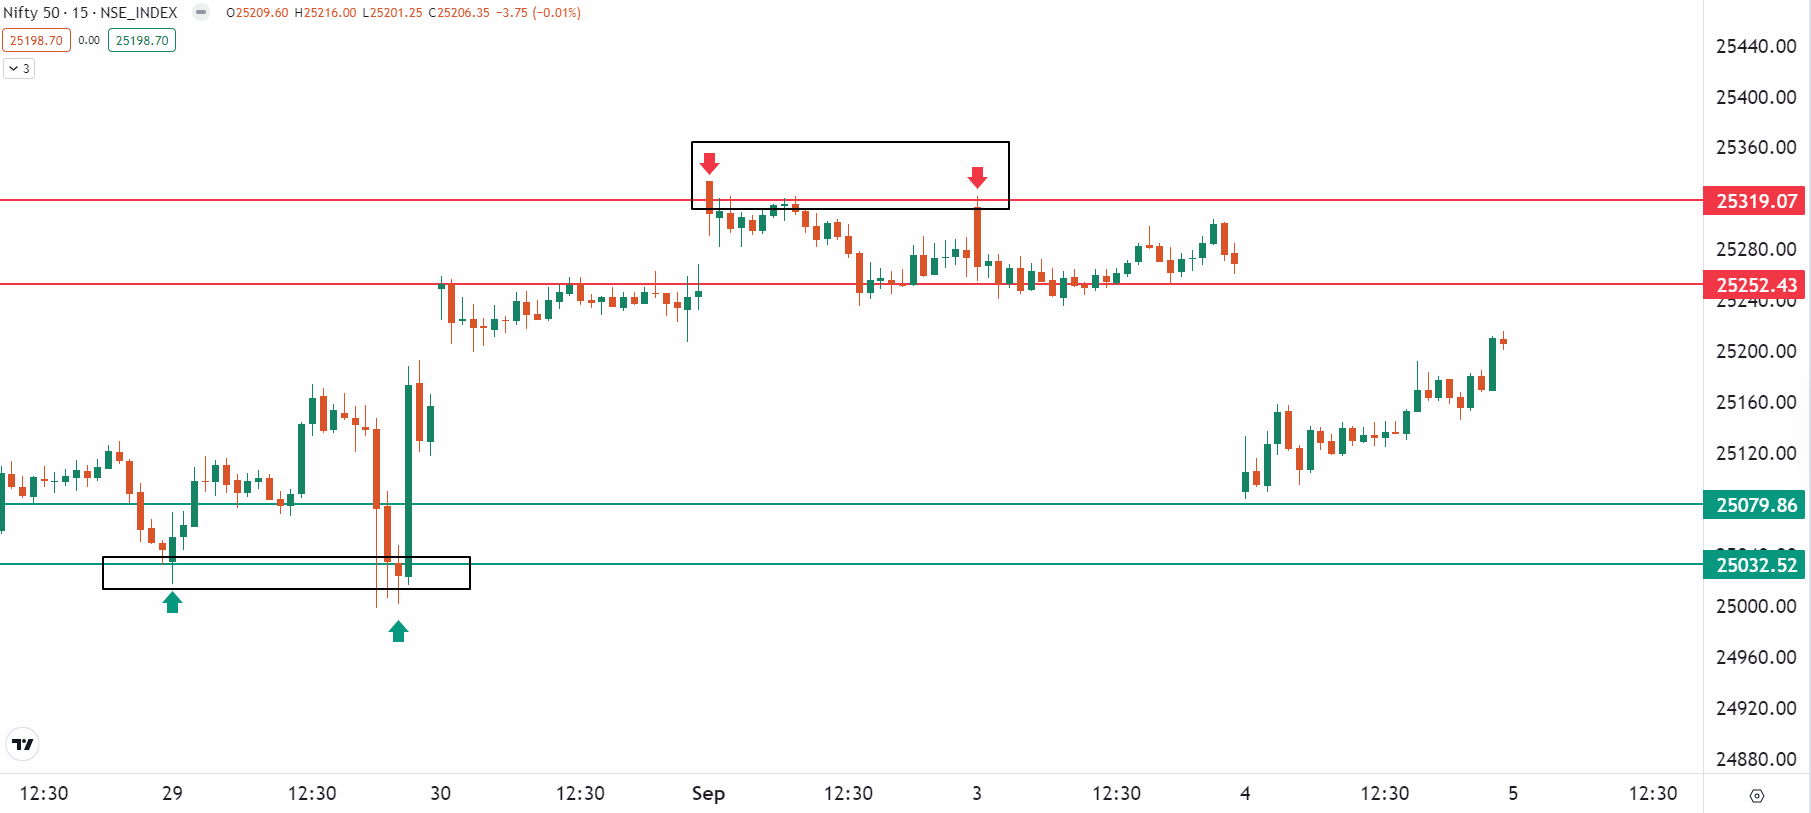
Meanwhile, open interest data is also in line with our shorter timeframe range. The NIFTY50 index for today's expiry has a strong call base at the 25,300 strike, while the put base remains at the 25,000 strike. This largely indicates that traders are expecting a range-bound move. However, if the index breaches these levels, it may provide directional insights.
BANK NIFTY
- September Futures: 51,607 (▼0.4%)
- Open Interest: 1,60,491 (▲1.9%)
After the gap down opening, the BANK NIFTY index traded in a narrow range following the initial volatility and ended the day below its important 50-day moving average (DMA). However, the index has formed a doji candlestick pattern on the daily chart, suggesting that traders are indecisive at current levels.
As you can see on the chart below, the index has formed a doji within the high and low area of the previous day's (3rd September) candle, which also makes it an inside bar. Bearing in mind the important support of the 20 DMA and the 50,900 zone, if the index closes below the low of the 3rd September candle, we can expect some weakness. Conversely, a close above the high will signal fresh entry of buyers and index can move towards 52,000 mark.
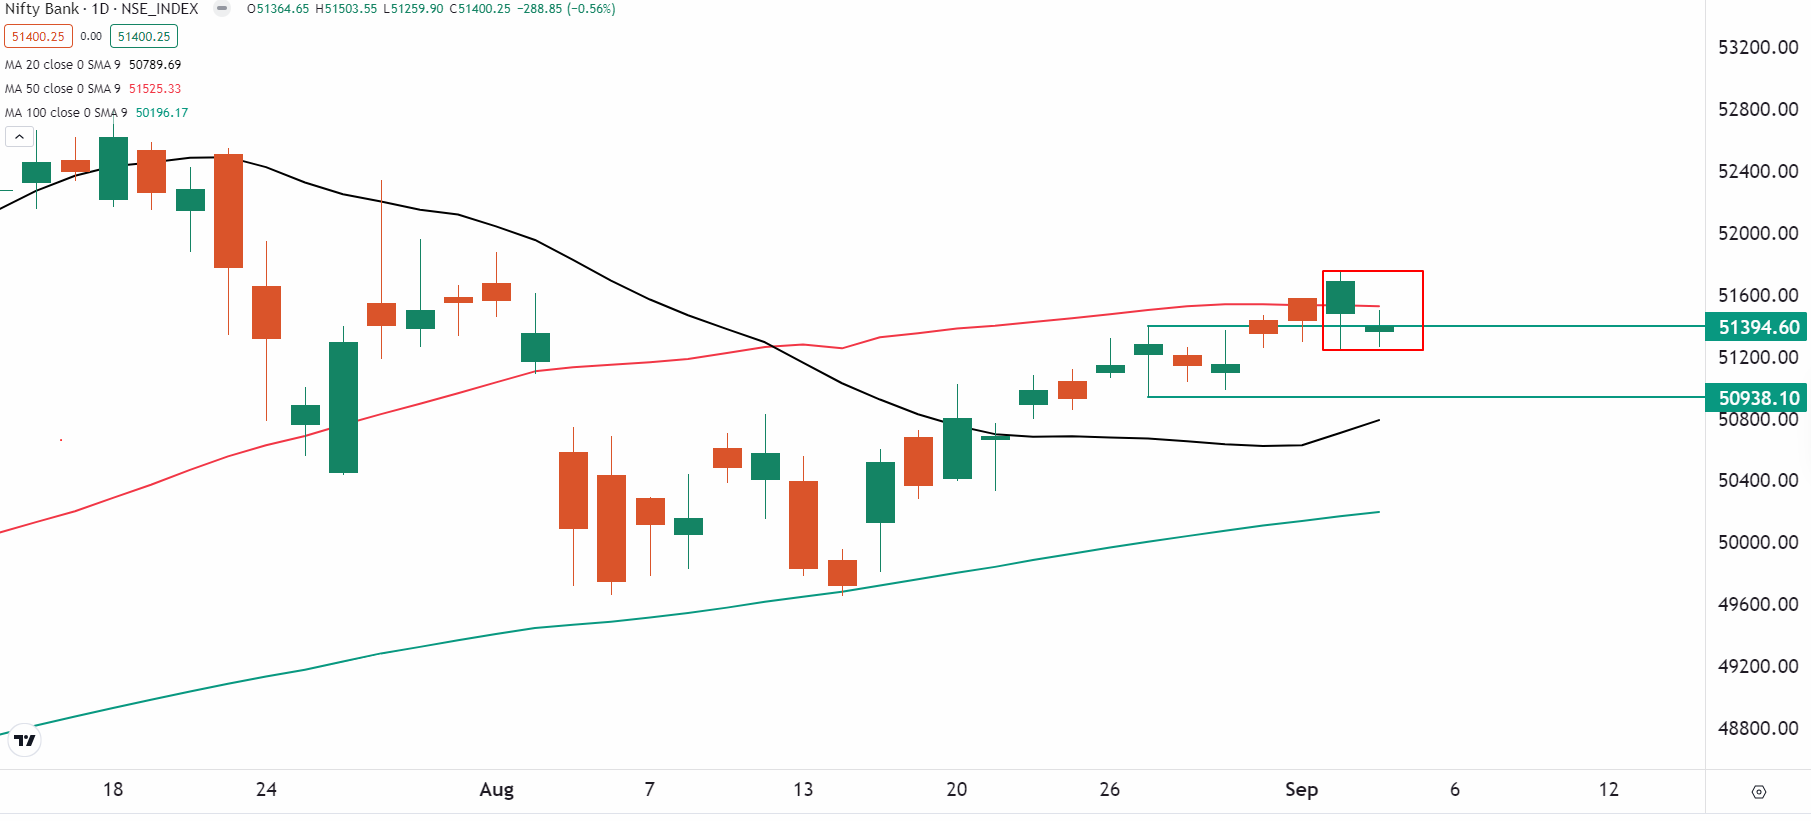
The initial open interest data of the 11 September expiry has significant call base at 51,500 strike making it as immediate resistance. However, we will monitor the build-up of open interest closer to the weekly closing for better directional clues.
FII-DII activity
Stock scanner
Under F&O ban: Aditya Birla Fashion and Retail, Balrampur Chini Mills, Hindustan Copper and RBL Bank
Added under F&O ban: RBL Bank
In Futures and Options or F&O, long build-up means an increase in Open Interest (OI) along with an increase in price, and short build-up means an increase in Open Interest(OI) along with a decrease in price.
Source: Upstox and NSE.
Disclaimer: Derivatives trading must be done only by traders who fully understand the risks associated with them and strictly apply risk mechanisms like stop-losses. The information is only for consumption by the client and such material should not be redistributed. We do not recommend any particular stock, securities and strategies for trading. The securities quoted are exemplary and are not recommendatory. The stock names mentioned in this article are purely for showing how to do analysis. Take your own decision before investing.
About The Author
Next Story

