Market News
Trade setup for March 5: NIFTY50 consolidates around 22,000 as selling pressure persists for 10th session
.png)
4 min read | Updated on March 05, 2025, 07:20 IST


SUMMARY
The NIFTY50 index extended the losing streak to tenth consecutive session, consolidating around the crucial support zone of 22,000. Meanwhile, the options data for the 6 March expiry saw significant call base at 22,200 strike, while the put base was seen at 22,000 strike. A break of these levels will provide further directional clues.
Stock list
The SENSEX consolidated around the critical 73,000 support zone, trading within a narrow range on options expiry day. | Image: Shutterstock
Asian markets @ 7 am
- GIFT NIFTY: 22,126 (-0.09%)
- Nikkei 225: 37,366 (+0.10%)
- Hang Seng: 23,200 (+1.13%)
U.S. market update
- Dow Jones: 42,520 (▼1.5%)
- S&P 500: 5,778 (▼1.2%)
- Nasdaq Composite: 18,285 (▼0.3%)
The S&P 500 erased its post-election gains on Tuesday as markets reacted to tariffs on Canada, Mexico, and China. In response, Canada imposed immediate counter-tariffs on U.S. imports, while China announced 15% duties on U.S. farm products, including chicken and pork, set to take effect on March 10. Markets remain on edge as investors assess the broader economic impact.
NIFTY50
- Max call OI: 22,500
- Max put OI: 21,900
- (10 Strikes from ATM, Expiry: 6 March)
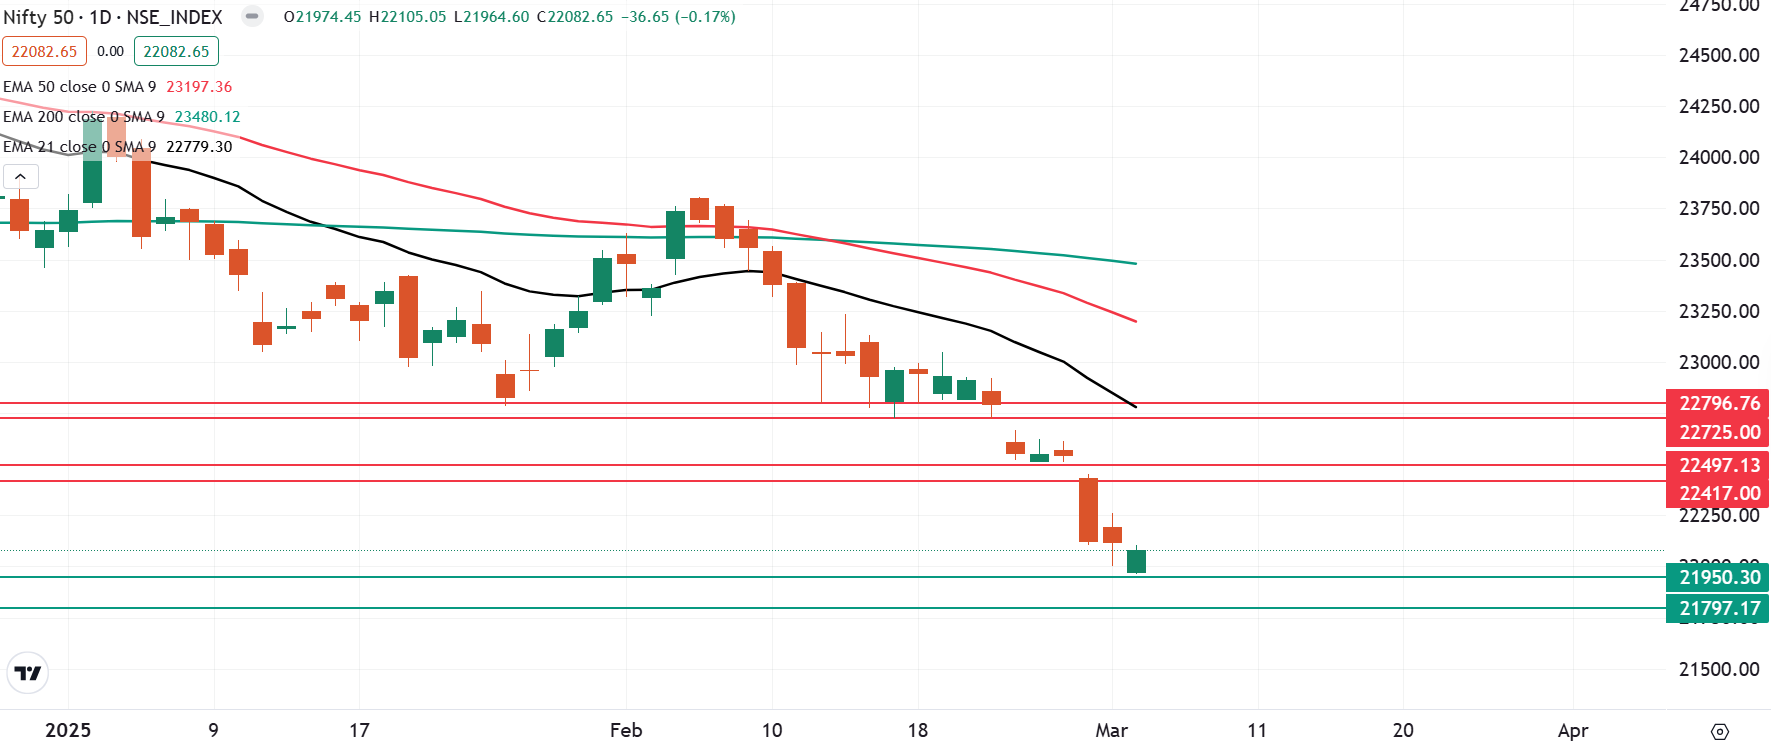
After opening with a gap-down, the NIFTY50 index rebounded from the crucial support zone of 22,000-21,900, successfully holding above the psychological level by the close. Despite the recovery, the index remained under pressure, facing selling pressure at higher levels amid escalating concerns over a global trade war. This downturn followed U.S. President Donald Trump's reaffirmation that 25% tariffs on Mexico and Canada, along with 20% tariffs on China, will take effect from March 4.
The daily chart of the NIFTY50 index indicates an oversold condition in the short term. The index has extended its losing streak to ten consecutive sessions and has failed to close above the previous session’s high for the past nineteen sessions, highlighting persistent weakness in momentum.
Positionally, traders can monitor the high (22,261) of the doji candlestick pattern formed on 3 March. A rebound and close above this level can push the price towards 22,500 zone. On the other hand, a close below the crucial support zone of 21,900 will signal weakness.
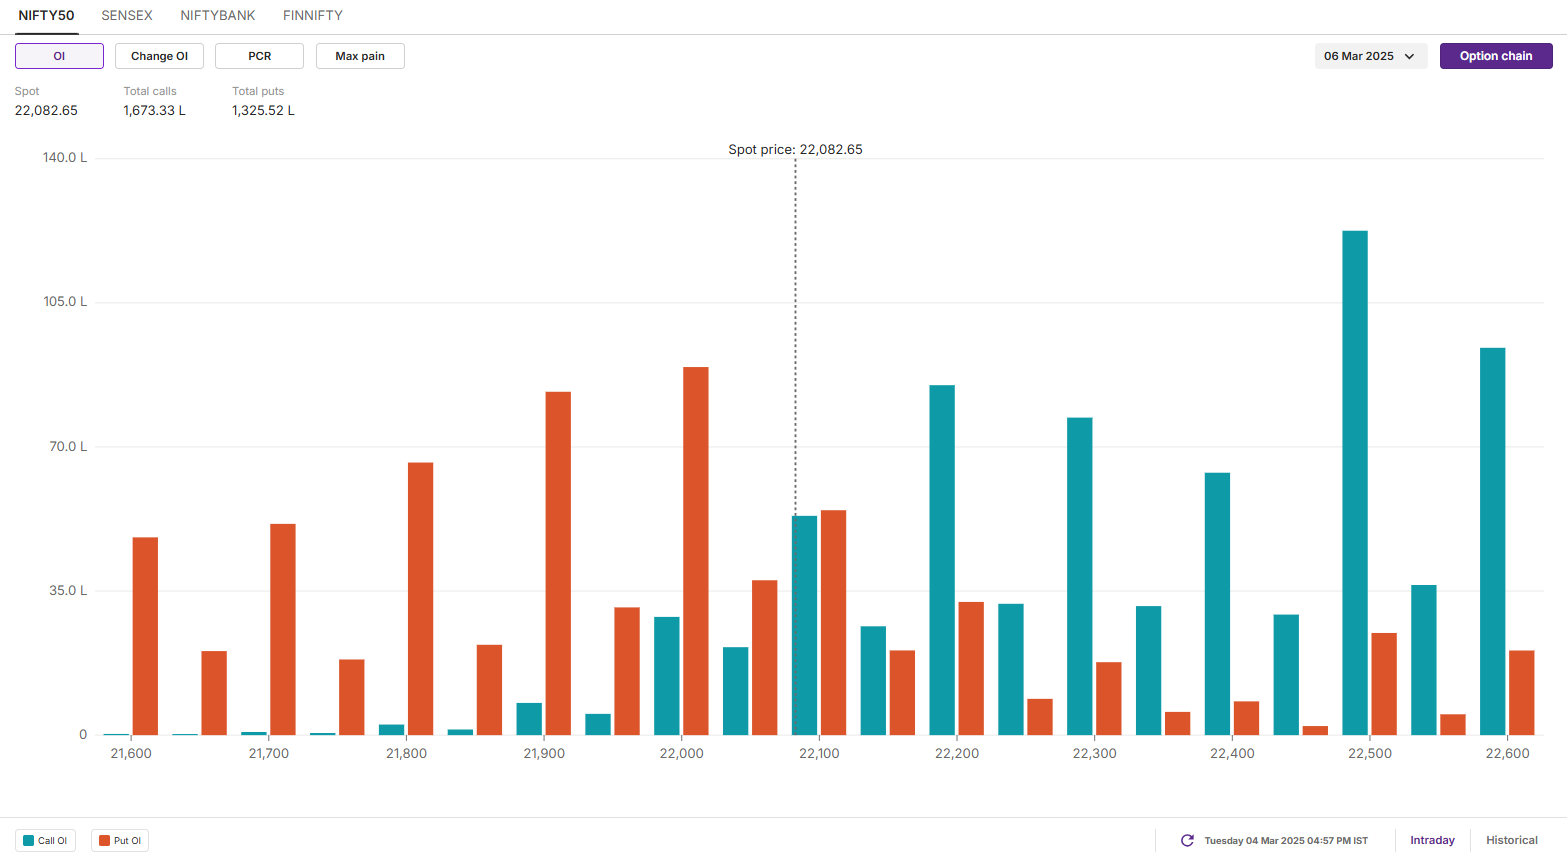
The open interest data for the 6 March expiry remains unchanged with significant put base around the 22,000 and 21,900 strikes. This indicates support for the index around this zone. On the flip side, the call base remains at 22,500 strike, hinting at resistance for the index around this zone.
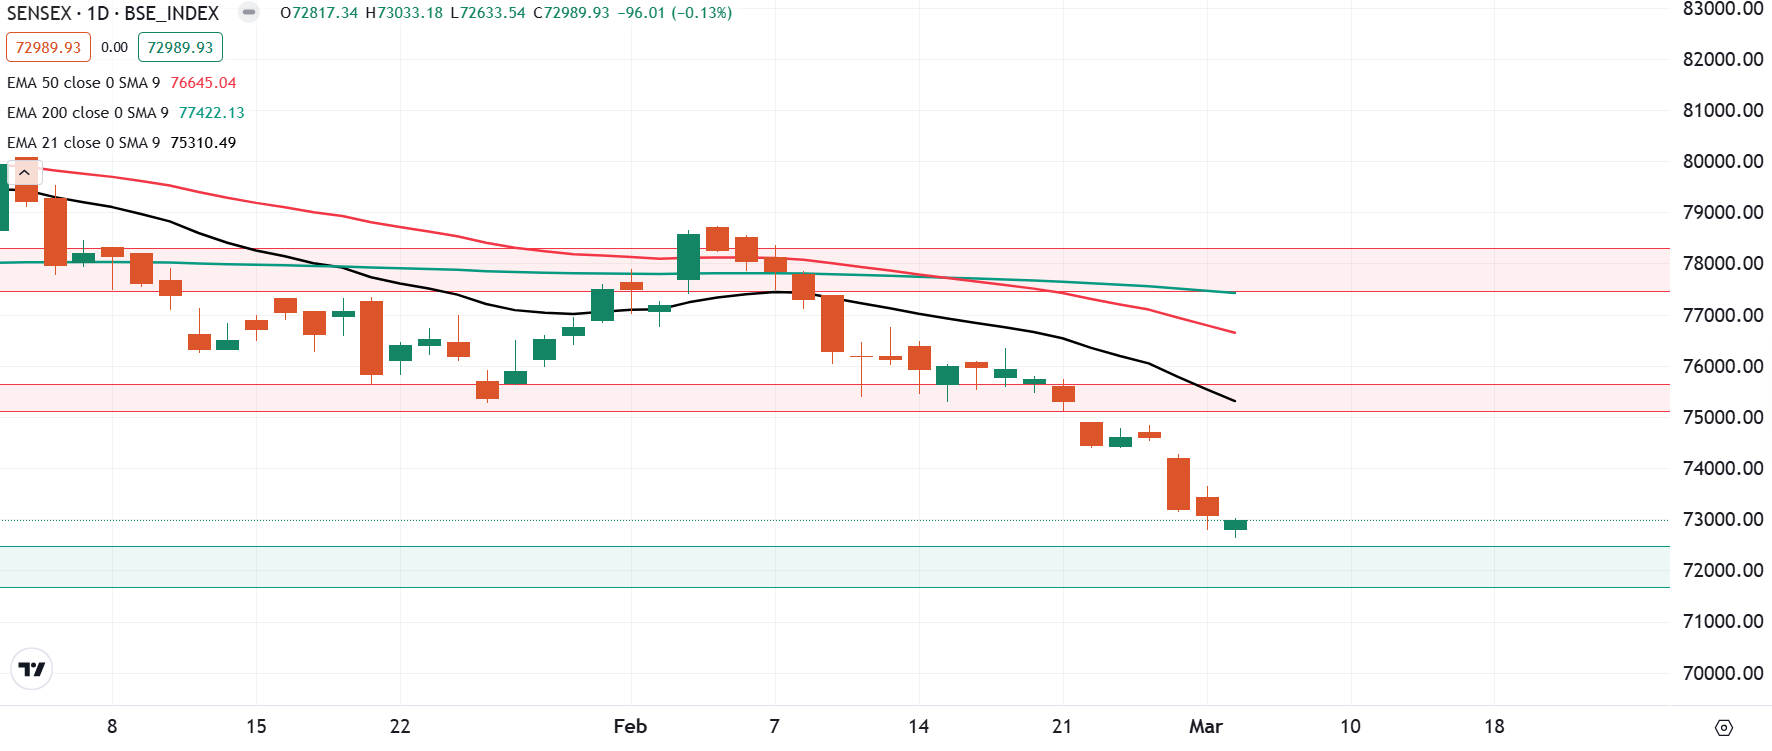
SENSEX
- Max call OI: 73,000
- Max put OI: 73,000
- (10 Strikes from ATM, Expiry: 11 March)
The SENSEX consolidated around the critical 73,000 support zone, trading within a narrow range on options expiry day. The index defended the low of the Doji candlestick formed on March 3, signaling immediate support at this level.
However, the broader trend remains weak, with the index in an oversold condition in the short term. Key support lies at 71,600, and notably, the index has failed to close above the previous session’s high for 19 consecutive trading sessions.
In the coming sessions, traders should watch the Doji candle’s high (73,649). A close above this level could trigger a rebound toward 75,000, while a close below 71,600 may lead to further downside.
FII-DII activity
Stock scanner
- Long build-up: CESC, CG Power, Titagarh Rail Systems, Cholamandalam Investment and REC
- Short build-up: Bajaj- Auto, Adani Green, Supreme Industries, Tata Technologies and Astral
- Top traded futures contracts: HDFC Bank, State Bank of India, ICICI Bank, Reliance Industries and BSE
- Top traded options contracts: BSE 4500 CE, HAL 3300 CE, Voltas 1400 CE and SBI 720 CE
- Under F&O ban: -
In Futures and Options or F&O, long build-up means an increase in Open Interest (OI) along with an increase in price, and short build-up means an increase in Open Interest(OI) along with a decrease in price. Source: Upstox and NSE.
Disclaimer: Derivatives trading must be done only by traders who fully understand the risks associated with them and strictly apply risk mechanisms like stop-losses. The information is only for consumption by the client and such material should not be redistributed. We do not recommend any particular stock, securities and strategies for trading. The securities quoted are exemplary and are not recommendatory. The stock names mentioned in this article are purely for showing how to do analysis. Take your own decision before investing.

About The Author
Next Story


