Market News
Trade setup for Jan 9: Can NIFTY50 hold the 23,500 level on the expiry day?
.png)
4 min read | Updated on January 09, 2025, 07:20 IST
SUMMARY
For today’s NIFTY50 expiry, traders should watch the key range of 23,500 to 23,850. A decisive breakout from this range, marked by a strong candle, could offer clear directional cues. Until then, the index is likely to trade sideways within this zone.
Stock list

The SENSEX started Wednesday’s session on a negative note and recouped the intraday losses from the crucial support zone of 77,800.
Asian markets @ 7 am
- GIFT NIFTY: 23,722.00 (-0.14%)
- Nikkei 225: 39,683.09 (-0.75%)
- Hang Seng: 19,294.99 (+0.08%)
U.S. market update
- Dow Jones: 42,635 (▲0.2%)
- S&P 500: 5,918 (▲0.1%)
- Nasdaq Composite: 19,478 (▼0.0%)
U.S. indices closed Wednesday's choppy session on a mixed note as investors reacted to reports that President-elect Donald Trump is considering declaring a national economic emergency to facilitate new tariffs.
Meanwhile, minutes from the U.S. Federal Reserve’s December meeting highlighted plans for a gradual pace of rate cuts in 2025. Fed officials indicated that inflation is expected to continue trending toward the 2% target range. However, they cautioned that the process may take longer than anticipated due to potential changes in trade and immigration policies.
NIFTY50
- January Futures: 23,781 (▼0.0%)
- Open interest: 5,17,103 (▲2.1%)
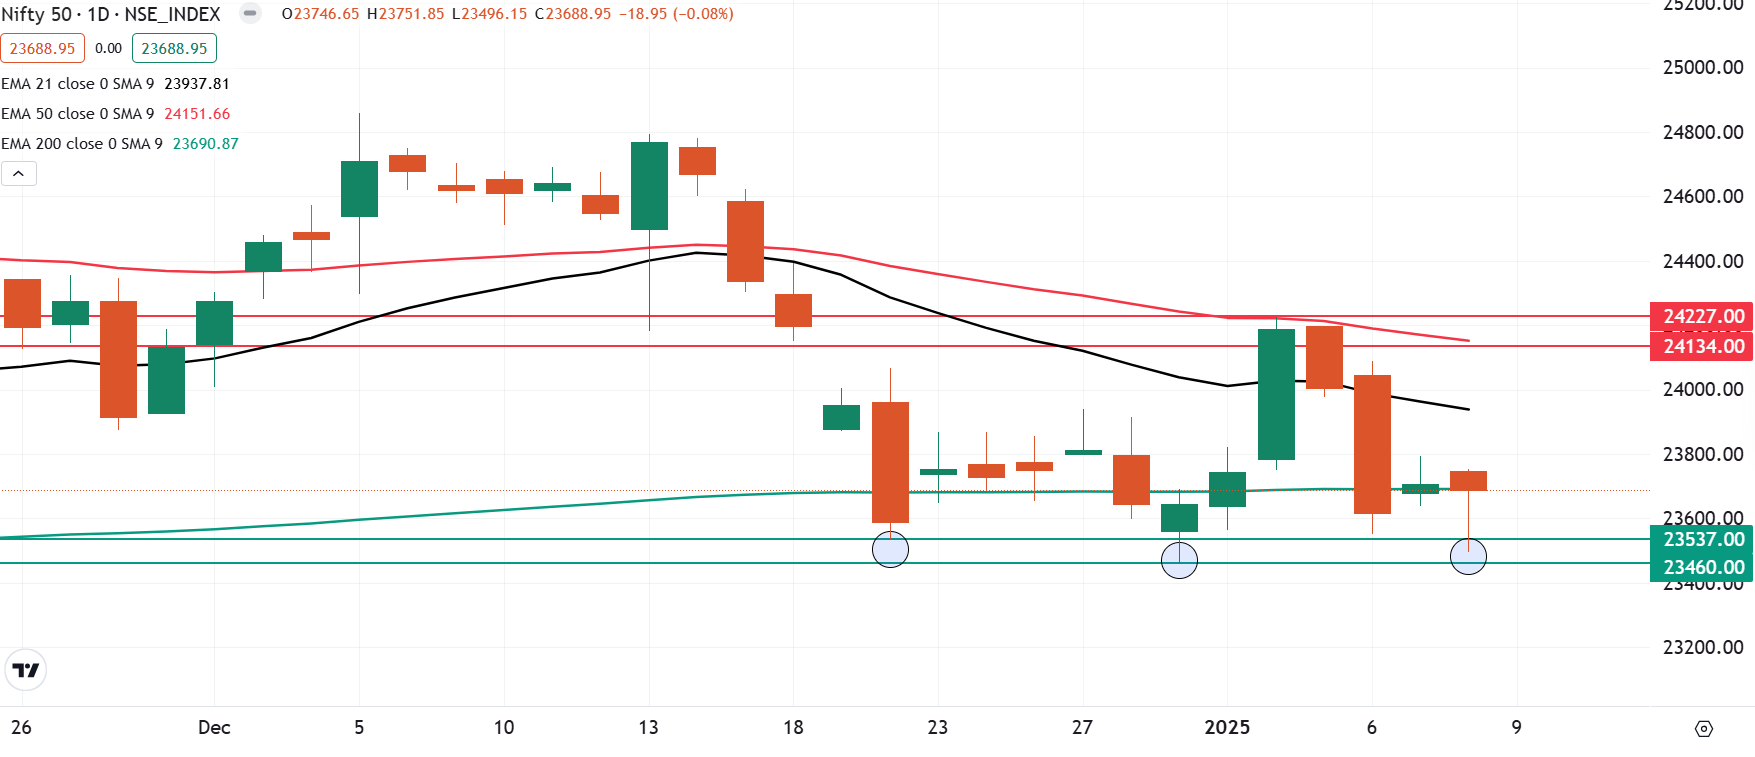
After an initial dip, the NIFTY50 index staged a sharp recovery of nearly 200 points from the day’s low and ended the Wednesday’s session on a flat note. The index formed a bullish hammer pattern on the daily chart, which is considered as a reversal pattern.
The hammer pattern typically forms at the end of a downtrend. It features a small real body near the top of the candle with a long lower shadow, indicating strong buying pressure after lower levels. However, the pattern gets confirmed if the close of the subsequent candle is above the high of the reversal pattern.
On the daily chart, despite breaking below the inside candle pattern formed on January 8, the index staged a strong rebound from the key support zone of 23,400–23,500. Furthermore, it has consistently maintained the December 20 low of 23,537 on a closing basis. On the upside, immediate resistance is seen near the 24,200 zone.

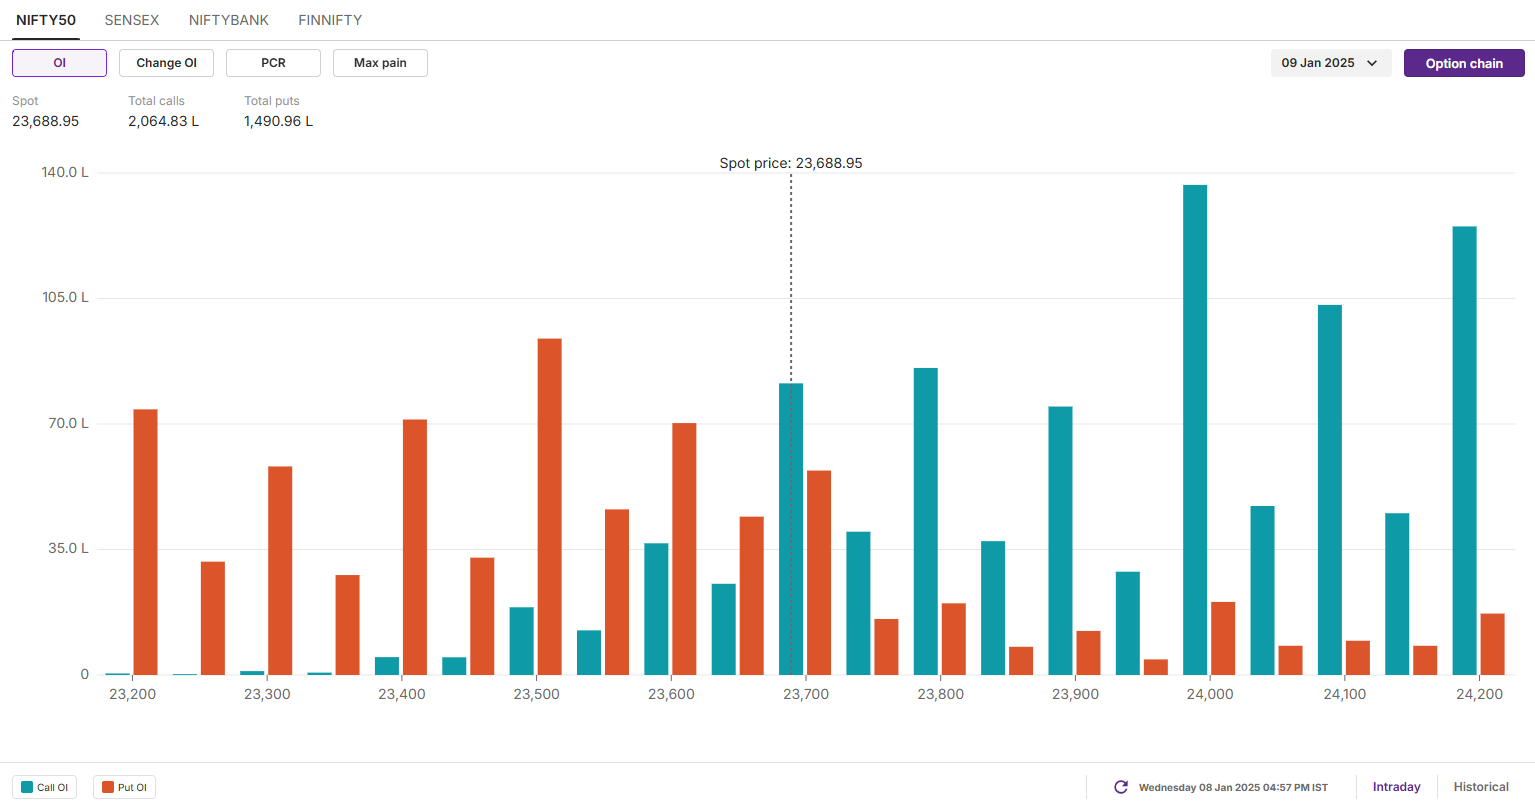
The open interest data for the 9 January expiry sustained the call bases at 24,000 and 24,100 strikes, pointing at resistance for the index around these levels. On the flip side, the put additions was seen at 23,500 strike and 23,200 strikes, indicating support for the index around these zones.

SENSEX
- Max call OI: 80,000
- Max put OI: 76,000
- (Expiry: 14 Jan)
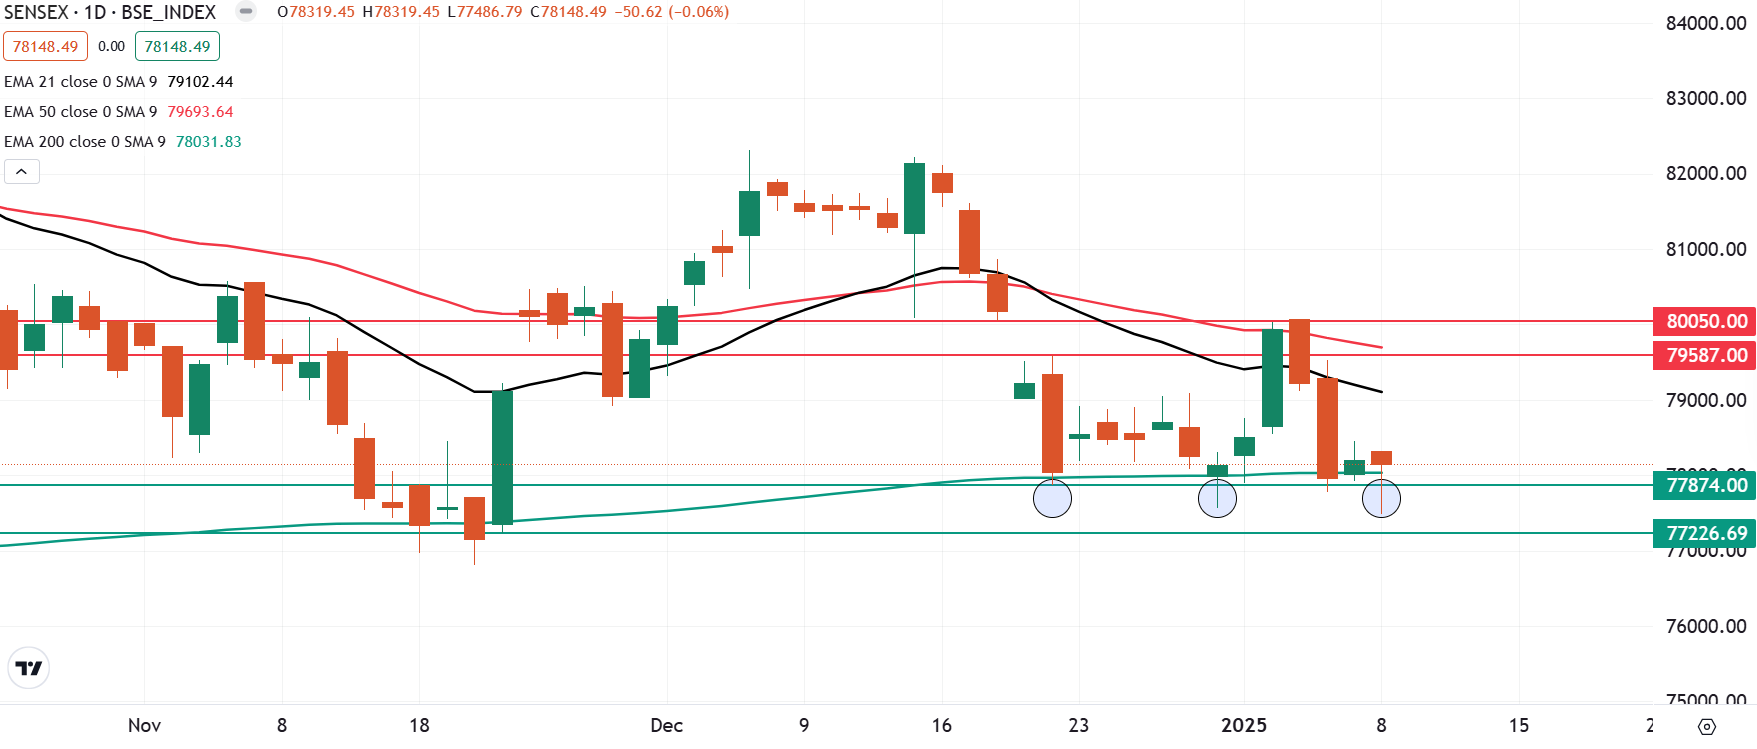
The SENSEX also started Wednesday’s session on a negative note and recouped the intraday losses from the crucial support zone of 77,800. The index rallied over 600 points from the day’s low and formed a bullish hammer candlestick pattern on the daily chart.
The index's technical structure remains range-bound, with immediate support at ₹77,800, corresponding to the low of the December 20 candle. A close below this level could extend weakness toward the ₹76,000 zone. Conversely, a sustained close above ₹80,000 would indicate strength and signal a potential trend reversal.

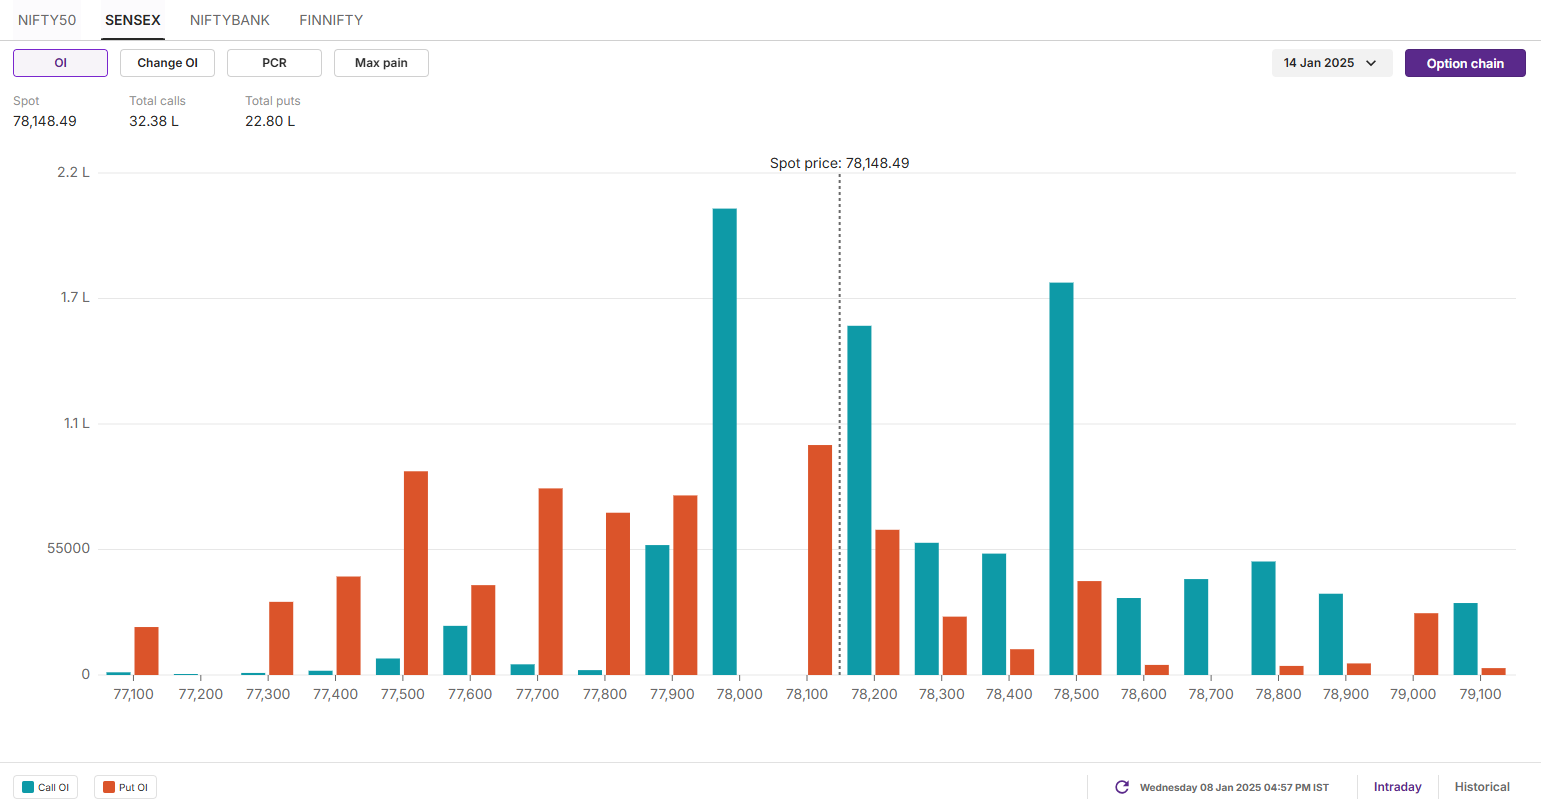
Open interest data for the January 14 expiry is dispersed, with a significant call base at the 79,000 strike and a put base at the 77,500 strike, establishing these levels as immediate resistance and support zones for the index. Additionally, substantial call and put activity at the 78,000 strike suggests potential consolidation around this level.

FII-DII activity
Stock scanner
- Long build-up: Oil India, L&T Finance, Berger Paints and ITC
- Short build-up: One 97 Communications (Paytm), United Breweries, PVR Inox, CG Power and Jindal Stainless
- Under F&O ban: Bandhan Bank, Hindustan Copper, Manappuram Finance, L&T Finance and RBL Bank
- Added under F&O ban: L&T Finance
In Futures and Options or F&O, long build-up means an increase in Open Interest (OI) along with an increase in price, and short build-up means an increase in Open Interest(OI) along with a decrease in price.
Source: Upstox and NSE.
Disclaimer: Derivatives trading must be done only by traders who fully understand the risks associated with them and strictly apply risk mechanisms like stop-losses. The information is only for consumption by the client and such material should not be redistributed. We do not recommend any particular stock, securities and strategies for trading. The securities quoted are exemplary and are not recommendatory. The stock names mentioned in this article are purely for showing how to do analysis. Take your own decision before investing.
About The Author
Next Story

