Market News
Trade setup for Jan 8: NIFTY50 consolidates at 200 EMA with inside candle formation
.png)
4 min read | Updated on January 08, 2025, 07:23 IST
SUMMARY
The NIFTY50 index formed an inside candle on January 7 following a sharp decline, resembling a bullish harami pattern on the daily chart. However, confirmation of this pattern requires the index to close above the high of the next candle.

The NIFTY50 index snapped its two day losing streak and ended the Tuesday’s session on a positive note.
Asian markets @ 7 am
- GIFT NIFTY: 23,769.50 (+0.05%)
- Nikkei 225: 39,821.23 (-0.65%)
- Hang Seng: 19,390 (-0.30%)
U.S. market update
- Dow Jones: 42,528 (▼0.4%)
- S&P 500: 5,909 (▼1.1%)
- Nasdaq Composite: 19,489 (▼1.8%)
U.S. indices closed Tuesday’s session in the red as stronger-than-expected economic data reignited fears of persistently high inflation in 2025. The manufacturing PMI showed an expansion last month, climbing to a two-month high of 64.4 from 58.2.
Meanwhile, job openings exceeded expectations in November, with data revealing 8.1 million openings, up from 7.8 million in October — the highest level since May 2023.
NIFTY50
- January Futures: 23,795 (▲0.2%)
- Open interest: 5,06,044 (▲1.7%)
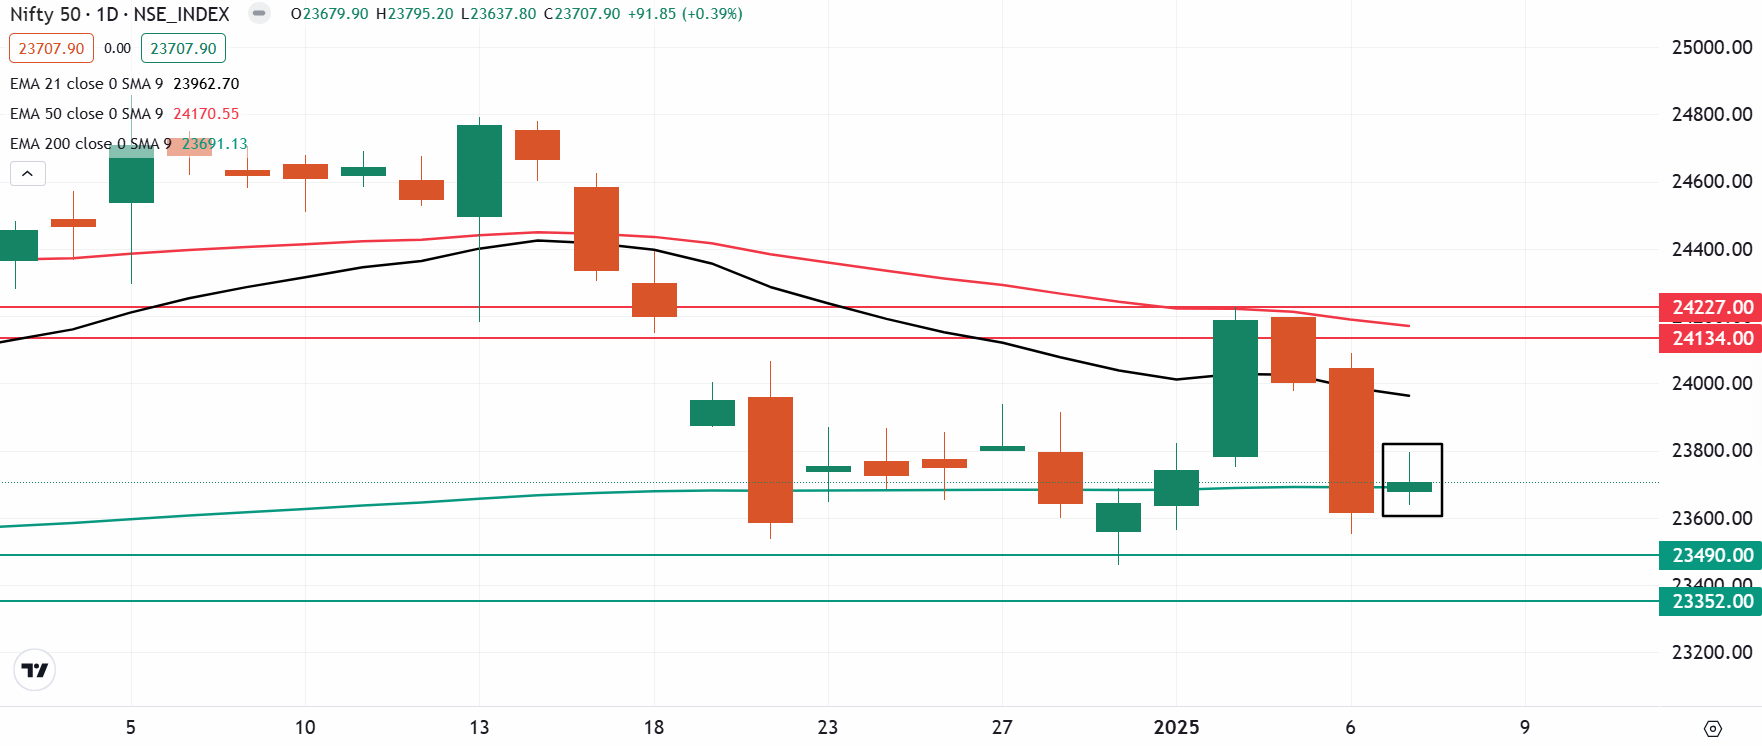
The NIFTY50 index snapped its two day losing streak and ended the Tuesday’s session on a positive note. The index formed a inside candlestick pattern on the daily chart, resembling the bullish harami pattern.
A bullish harami is a two-candlestick pattern which consists of a large bearish candle followed by a smaller bullish candle. The body of the smaller candle is entirely within the range of the previous candle. However, the pattern gets confirmed if the close of the subsequent candle is above the high of the reveral pattern.
The broader technical structure of the index remains bearish, with immediate resistance positioned around the 23,850–24,000 zone. For the bulls to shift the trend, reclaiming these levels is crucial. Conversely, a breakdown below 23,500 could intensify the decline, targeting the critical support zone near 23,300.

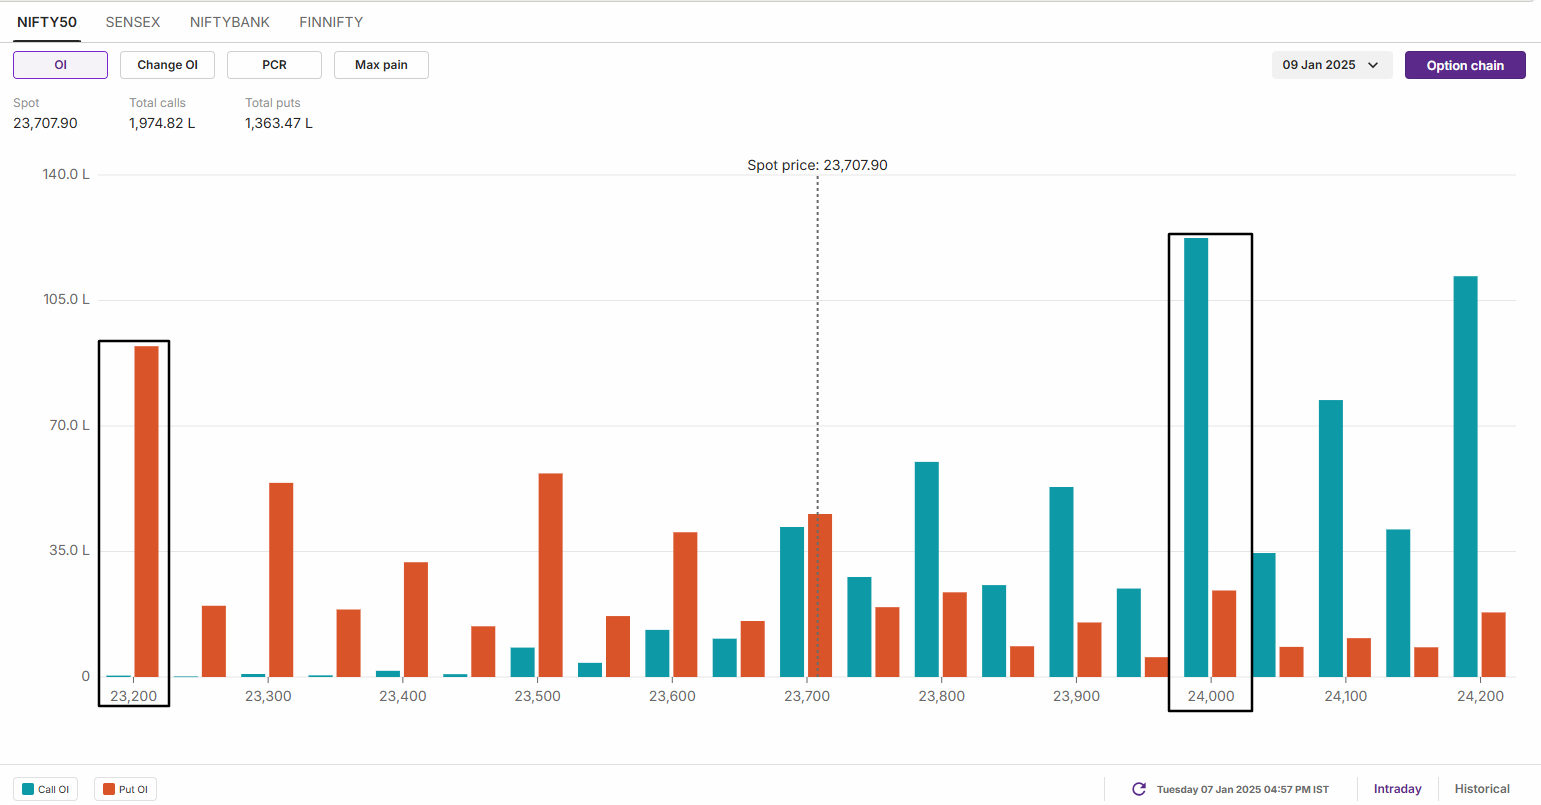
The open interest positioning of the index for 9 January expiry remains in favour of bears with significant call base at 24,000 and 24,100 strikes. This indicates that market participants are expecting index to take resistance around this zone. On the flip side, the put base was seen at 23,200 and 23,500 strikes with relatively low volume, suggesting support for the index around these levels.

SENSEX
- Max call OI: 80,000
- Max put OI: 76,000
- (Expiry: 14 Jan)
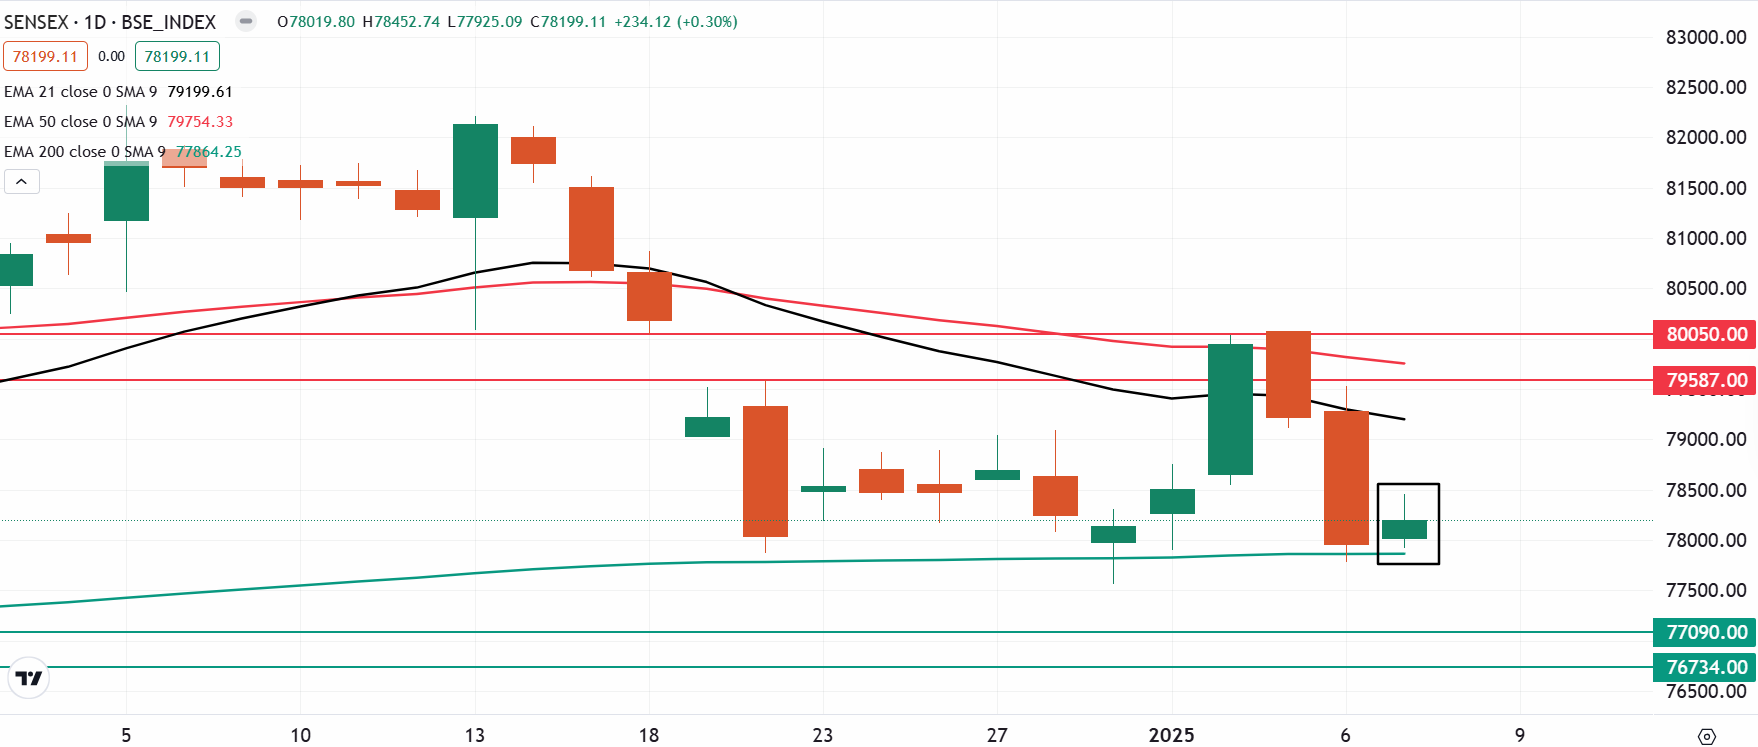
The SENSEX recouped some of its minor losses on the weekly expiry of its options contracts and ended Tuesday’s session in the green. The index formed an inside candlestick pattern on the daily chart around the crucial support of 200 EMA.
On the daily chart, the index is trading near its 200 EMA, a psychologically significant support level. In the coming sessions, a close below the low of January 6 could extend the weakness towards the 76,700 zone. Conversely, if the index reclaims the immediate resistance near 79,000, the trend may shift in favor of the bulls.

FII-DII activity
Stock scanner
- Long build-up: Biocon, ONGC, Cyient, Max Healthcare, and Oil India
- Short build-up: Kalyan Jewellers, PVR Inox and Info-Edge (Naukri)
- Under F&O ban: Bandhan Bank, Hindustan Copper, Manappuram Finance and RBL Bank
- Added under F&O ban: Bandhan Bank
In Futures and Options or F&O, long build-up means an increase in Open Interest (OI) along with an increase in price, and short build-up means an increase in Open Interest(OI) along with a decrease in price. Source: Upstox and NSE.
Disclaimer: Derivatives trading must be done only by traders who fully understand the risks associated with them and strictly apply risk mechanisms like stop-losses. The information is only for consumption by the client and such material should not be redistributed. We do not recommend any particular stock, securities and strategies for trading. The securities quoted are exemplary and are not recommendatory. The stock names mentioned in this article are purely for showing how to do analysis. Take your own decision before investing.
About The Author
Next Story

