Market News
Trade setup for Jan 31: NIFTY50 struggles at 21 EMA, faces strong resistance at 23,350
.png)
4 min read | Updated on January 31, 2025, 07:13 IST


SUMMARY
The NIFTY50 index faced resistance around the 21-day exponential moving average and failed to capture the crucial level on closing basis. For the short-term clues, traders can monitor the 21-EMA. Unless the index reclaims this level on closing basis, the trend may remain negative.
Stock list

The NIFTY50 index extended the rebound for the third day in a row and closed the volatile session of the monthly expiry of F&O contracts in green. | Image: Shutterstock
Asian markets @ 7 am
- GIFT NIFTY: 23,436 (+0.06%)
- Nikkei 225: 39,536 (+0.06%)
- Hang Seng: Closed
U.S. market update
- Dow Jones: 44,882 (▲0.3%)
- S&P 500: 6,071 (▲0.5%)
- Nasdaq Composite: 19,681 (▲0.2%)
U.S. indices ended the Thursday's session on a positive note as investors digested earnings of megacap technology stocks. Shares of Tesla moved higher despite an earnings miss as investors took on trust its vow to return to growth in 2025. Meanwhile, Meta's quarterly earnings beat helped lift its shares, but Microsoft stock slumped, down 6%, after its cloud revenue fell short.
Additionally, towards the close, President Donald Trump announced 25% tariffs on Mexico and Canada, leading to a spike in the US dollar index.
NIFTY50
- February Futures: 23,418 (▲0.7%)
- Open interest: 2,30,614 (▲24.2%)
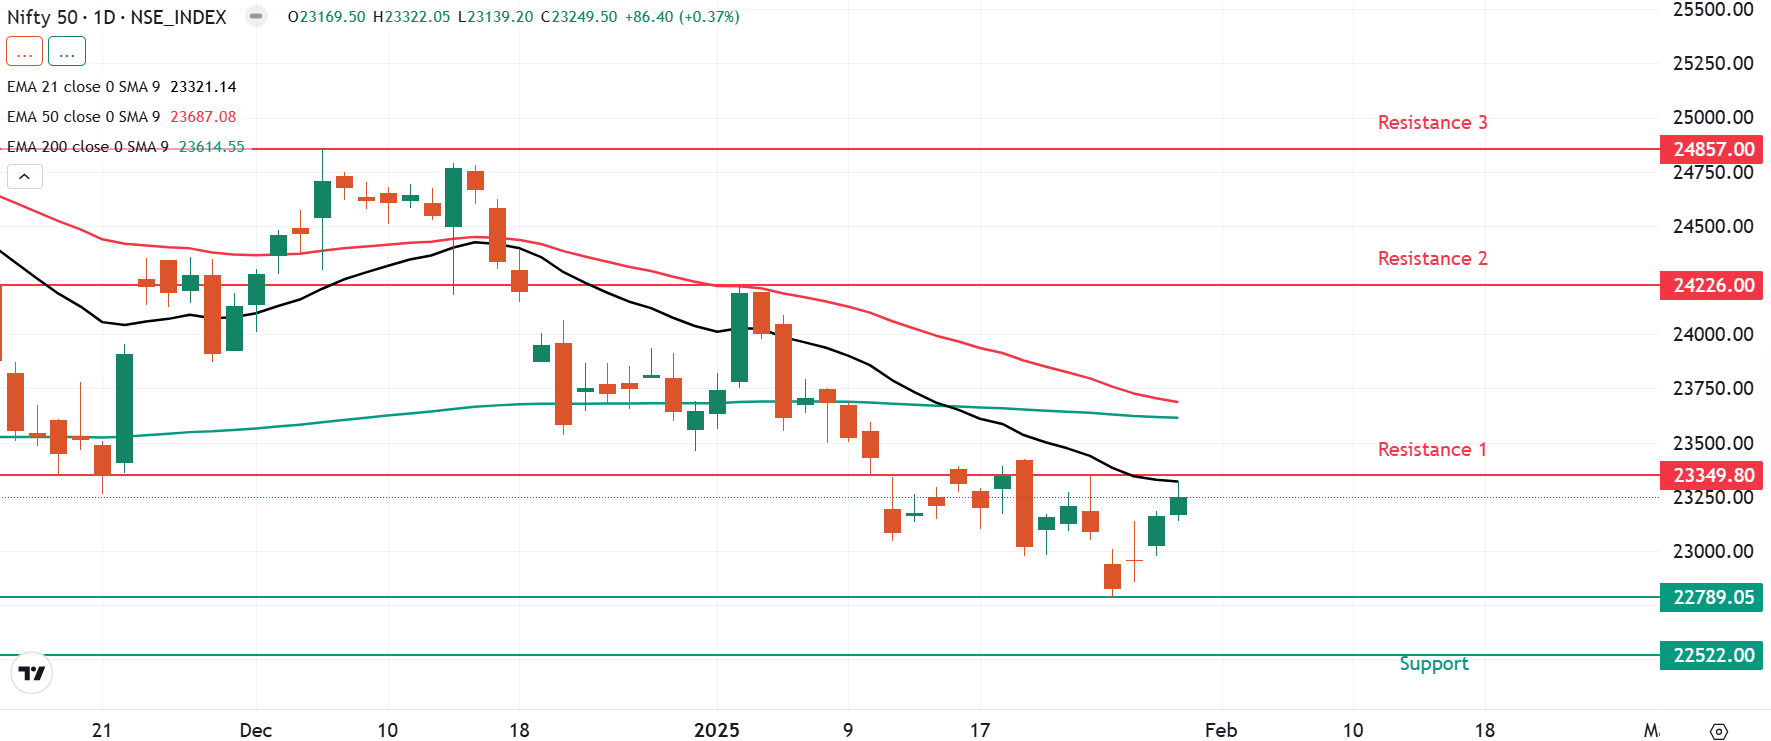
The NIFTY50 index extended the rebound for the third day in a row and closed the volatile session of the monthly expiry of F&O contracts in green. However, the index faced resistance around its 21-day exponential moving average (EMA) and failed to capture the crucial level on closing basis.
As per the weekly chart, the index is currently placed at the crucial support zone of 22,700 and 22,500 zone, which coincides with the breakout zone of May 2024 prior to the general elections. A close below this zone will signal further weakness. On the other hand, a close above the 50-weekly exponential moving average will signal change in the trend.
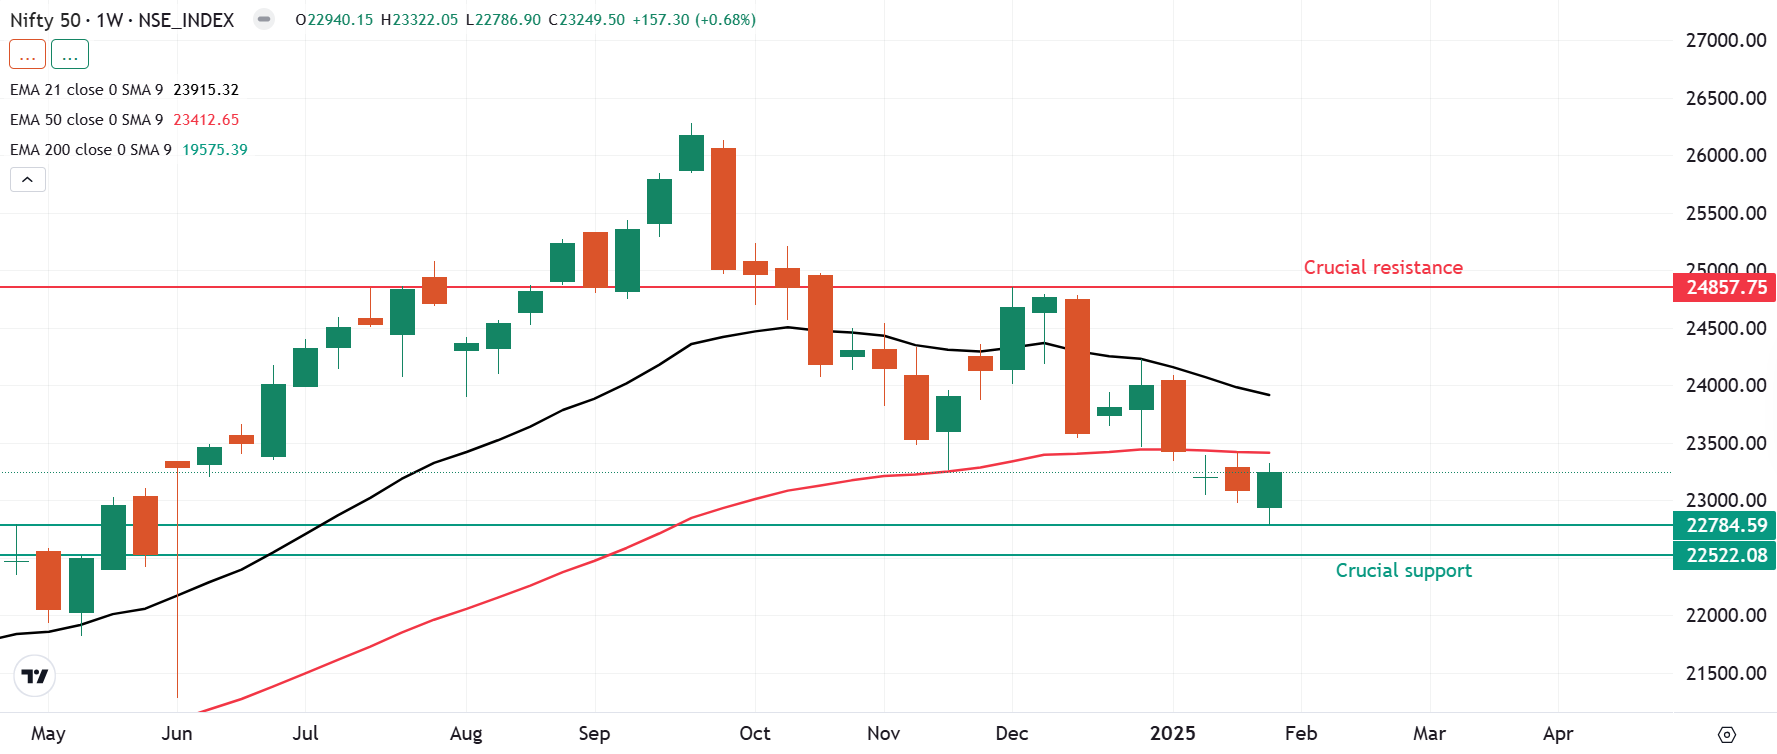
Meanwhile, the technical structure of the index as per the daily chart remains weak as it faced resistance around the 21-day exponential moving average. On the other hand, the crucial support for the index remains around the 22,700 and 22,500 zone. A break of these levels on closing basis will provide further clues.
BANK NIFTY
- February Futures: 49,686 (▲0.6%)
- Open interest: 97,501 (▲22.2%)
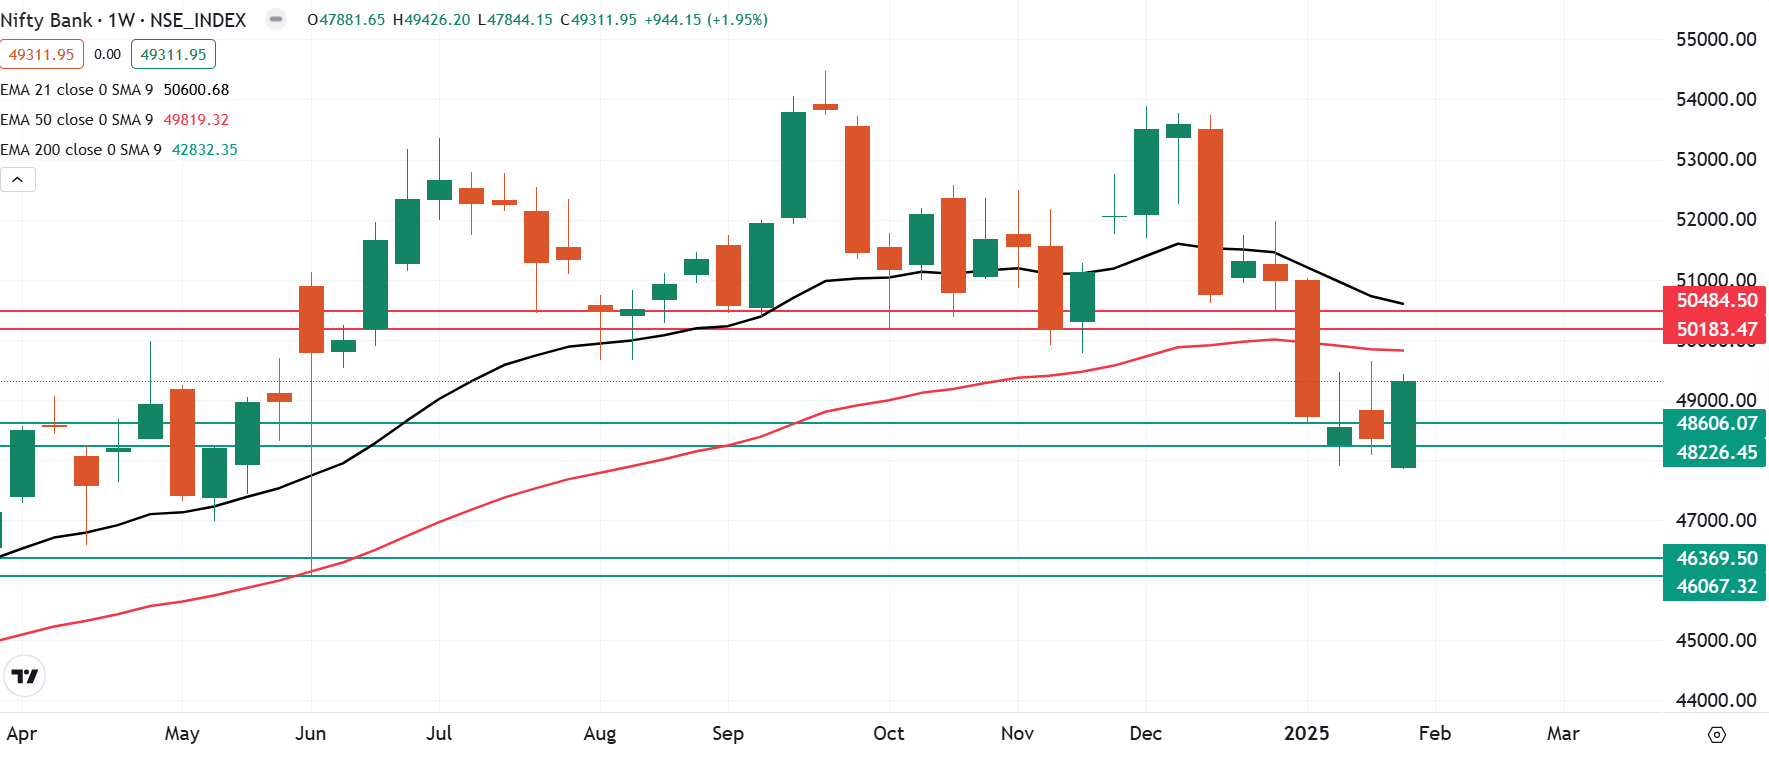
The BANK NIFTY index extended the winning streak for the third day in a row and closed the monthly expiry session of its futures and options contract on positive note. However, the index encountered strong resistance near the critical 21-day EMA zone and was subsequently rejected at this key level.
From the technical standpoint, the BANK NIFTY’s weekly chart remains weak as the index is currently trading below its 21 and 50- weekly exponential moving averages (EMA). The crucial resistance for the index is around 50,500 zone, while the immediate support is around the 48,000 zone.
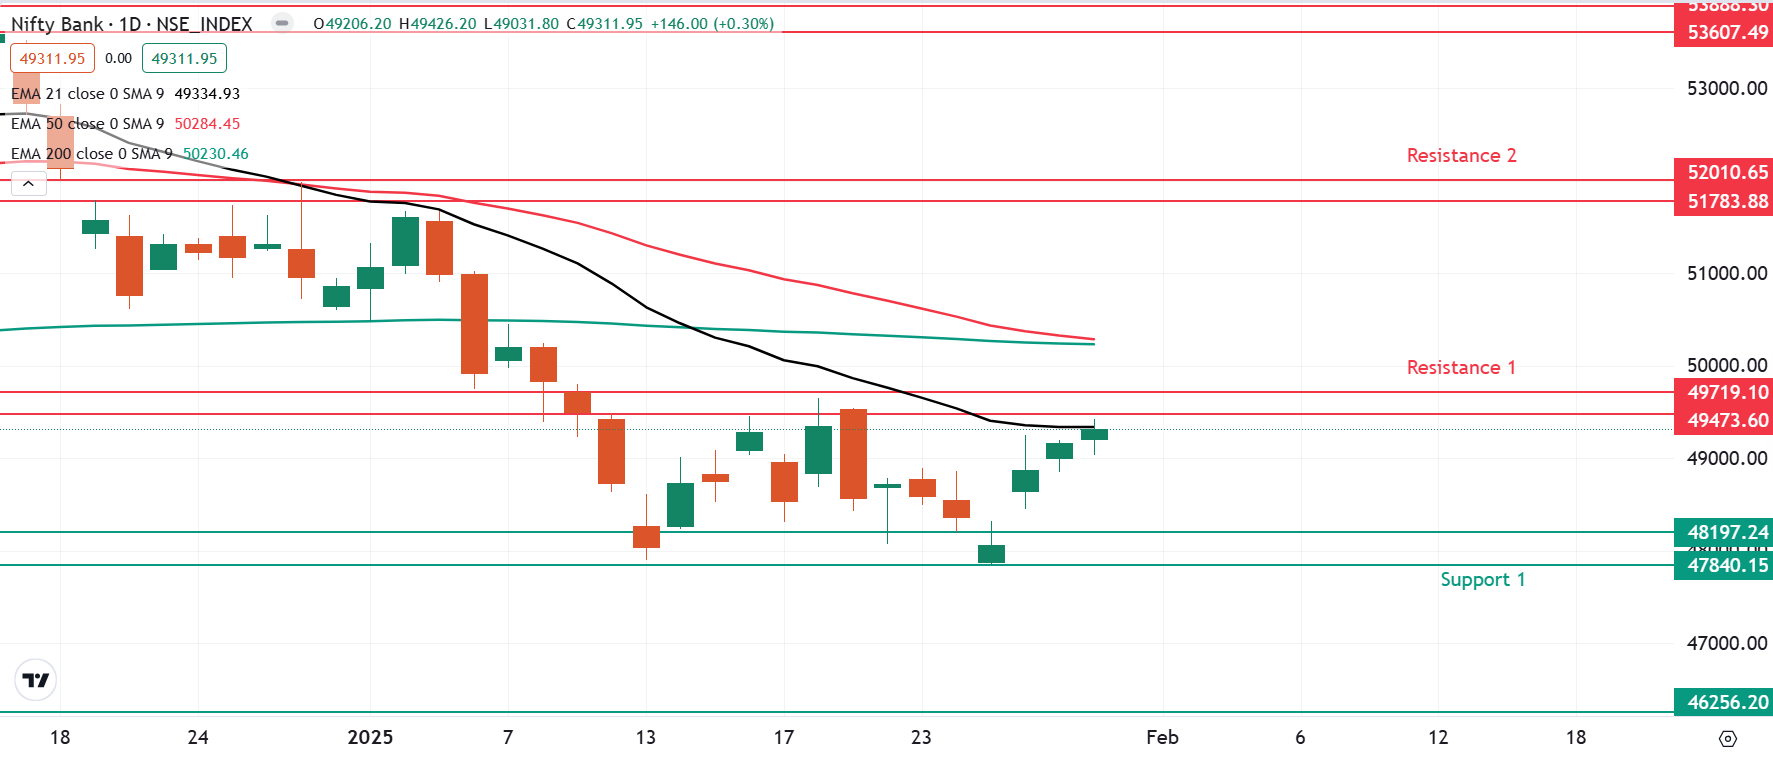
On the daily chart, the index extended the consolidation for the 15th consecutive session between the range of 49,700 and 47,800. It faced resistance around the 21-day EMA and failed to close above the crucial level. On the other hand, if the index slips below the 48,000 zone on closing basis, it may extend the weakness up to 46,000 zone.
FII-DII activity
Stock scanner
- Long build-up: SRF, Max Healthcare Institute, JSW Energy, Bajaj Finance, BEL and Navin Fluorine
- Short build-up: Voltas, ABB, Ambuja Cements, Adani Ports and Bajaj Finserv
- Under F&O ban: Nil
In Futures and Options or F&O, long build-up means an increase in Open Interest (OI) along with an increase in price, and short build-up means an increase in Open Interest(OI) along with a decrease in price. Source: Upstox and NSE.
Disclaimer: Derivatives trading must be done only by traders who fully understand the risks associated with them and strictly apply risk mechanisms like stop-losses. The information is only for consumption by the client and such material should not be redistributed. We do not recommend any particular stock, securities and strategies for trading. The securities quoted are exemplary and are not recommendatory. The stock names mentioned in this article are purely for showing how to do analysis. Take your own decision before investing.

About The Author
Next Story