Market News
Trade setup for Feb 12: NIFTY50 ends below Budget Day low, January lows now on the radar
.png)
4 min read | Updated on February 12, 2025, 07:21 IST


SUMMARY
After falling below the crucial support of the 21-day exponential moving average, the NIFTY50 extended its losing streak, breaking below the Budget Day low. This signals continued weakness in the index, with immediate resistance now set around the 23,300 zone.
Stock list

The NIFTY50 faced intensified selling pressure, extending its losing streak to five consecutive sessions. | Image: Shutterstock
Asian markets @ 7 am
- GIFT NIFTY: 23,183.5 (+0.24%)
- Nikkei 225: 38,911.68 (+0.28%)
- Hang Seng: 21,526.41 (+1.09%)
U.S. market update
- Dow Jones: 44,593 (▲0.2%)
- S&P 500: 6,068 (▲0.0%)
- Nasdaq Composite: 19,643 (▼0.3%)
U.S. indices remained largely unchanged on Tuesday as investors took note of Federal Reserve Chairman Jerome Powell’s cautious remarks on interest rates. Powell emphasised that the Fed is not in a hurry to make adjustments, while also steering clear of trade policy discussions. Powell is set to appear before the House Financial Services Committee on Wednesday, where investors will be looking for further insights into the Fed’s approach amid mounting economic challenges.
Meanwhile, trade tensions escalated as President Donald Trump signed new tariffs on all steel and aluminum imports to the U.S. The European Union quickly responded, warning of retaliatory levies if further tariffs are imposed on its goods.
NIFTY50
- February Futures: 23,153 (▼1.3%)
- Open interest: 2,29,879 (▲0.8%)
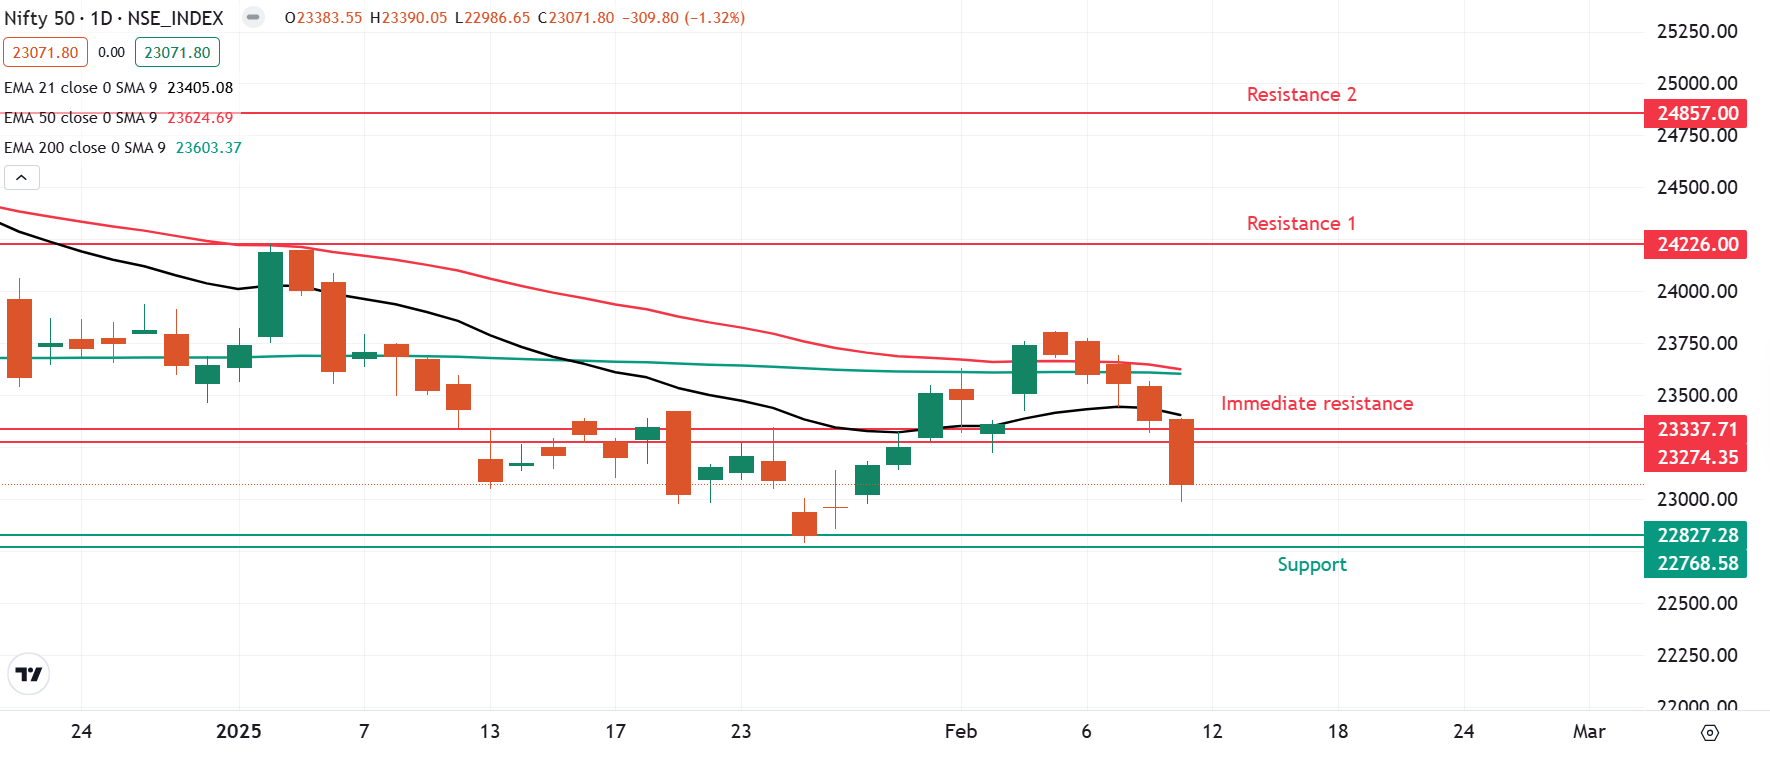
The NIFTY50 faced intensified selling pressure, extending its losing streak to five consecutive sessions. The index declined 1.3% amid concerns over U.S. tariffs, briefly dipping below the critical 23,000 level during intraday trade and forming a bearish candlestick on the daily chart.
On February 11, the index also gave up its 21-day exponential moving average, deepening its bearish momentum below the key 23,300 support zone. Moving forward, this level will now act as an immediate resistance. Despite holding the psychologically crucial 23,000 mark on a closing basis, the next major support lies near 22,700—the January 2025 low. A decisive break below this level could signal further downside, whereas a sustained move above 23,800 on a closing basis would shift the broader trend back in favor of the bulls.
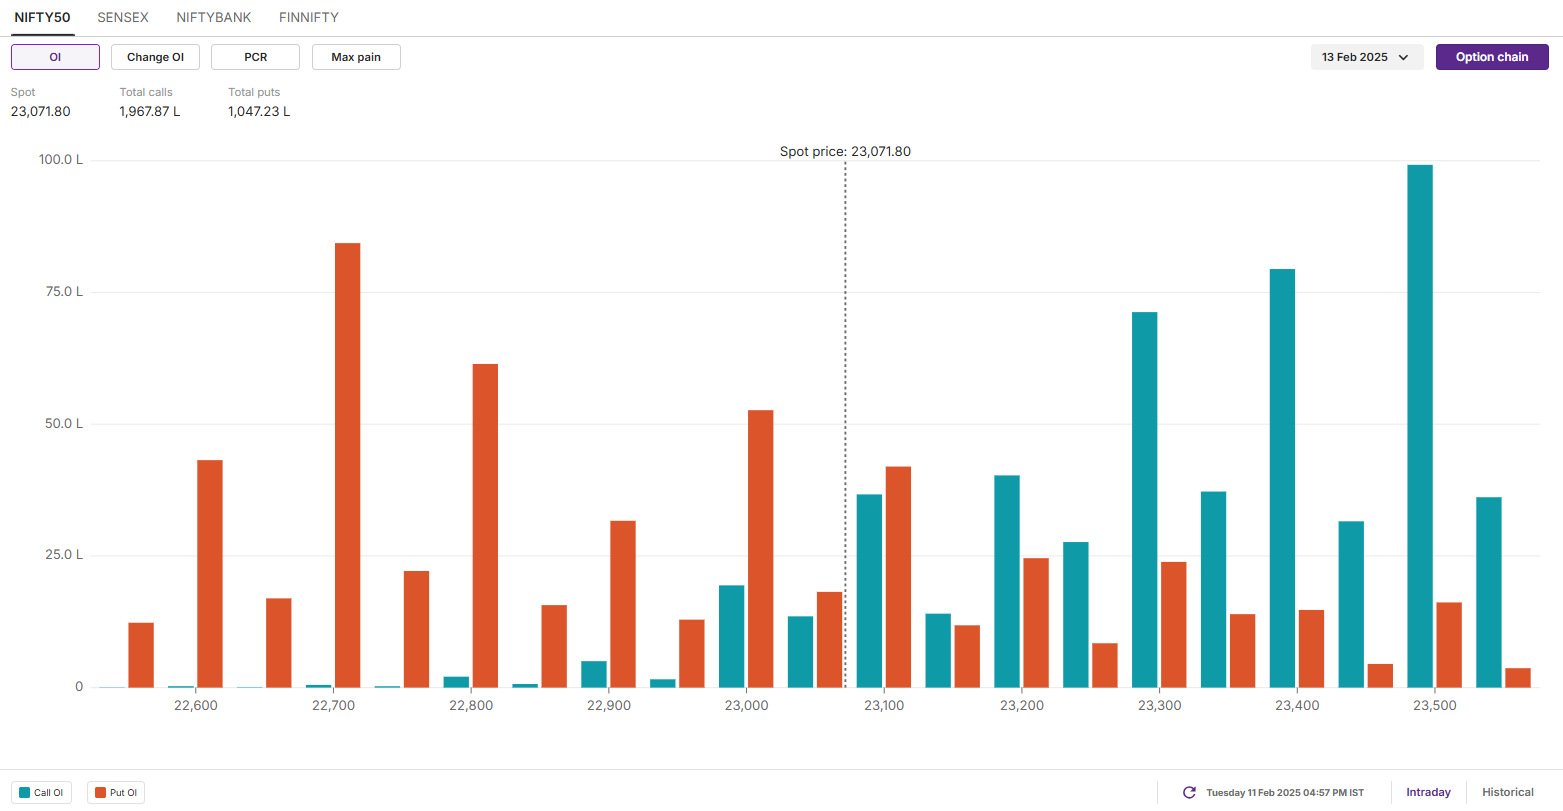
The open interest data for the 13 February expiry saw significant call base at 23,500 strike, suggesting resistance for the index around this level. On the flip side, the put base shifted to 22,700 strike, marking this zone as next crucial support zone for the index.
SENSEX
- Max call OI: 77,500
- Max put OI: 75,000
- (30 Strikes from ATM, Expiry: 18 Feb)
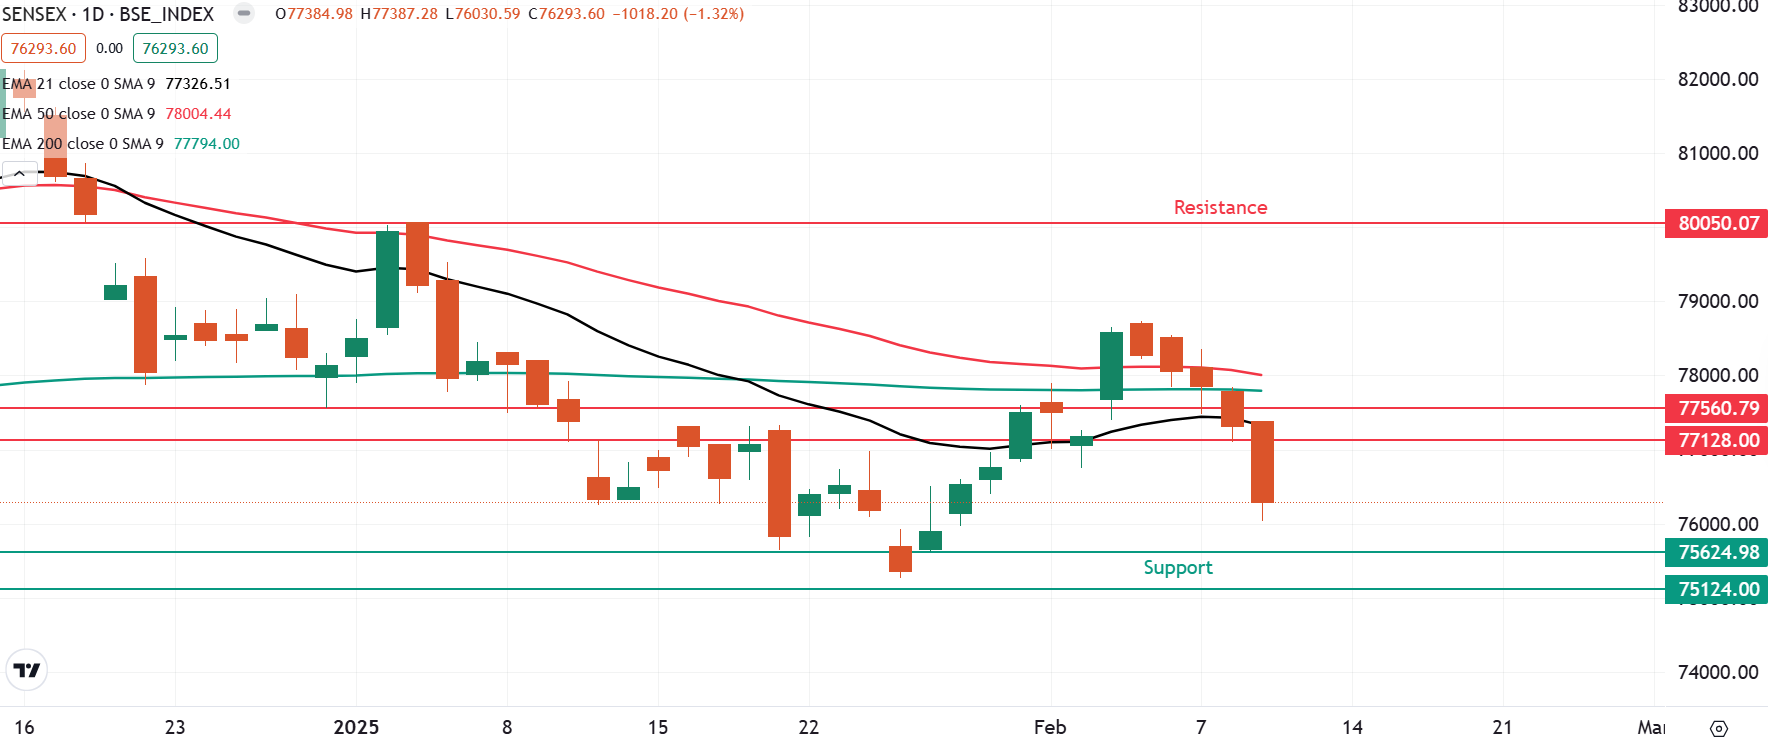
The SENSEX also slipped over 1.3% on the weekly expiry of its options contracts and ended the February 11 session on the negative note. The index formed a bearish candle on the daily chart and slipped below the crucial support zone of 77,100 and the budget day low.
The technical structure of the SENSEX as per the daily chart looks weak with the index currently trading below the 21, 50 and 200-day exponential moving averages. For the upcoming sessions, traders can monitor the range of 78,000 and 75,000. If the index breaks ends below the crucial support zone of 75,000, then it may further extend the weakness. Meanwhile, the trend will change in favour of bulls if the index reclaims the immediate support zone of 21-day EMA (77,326).
FII-DII activity
Stock scanner
- Long build-up: Nil
- Short build-up: Apollo Hospitals, Eicher Motors, Max Healthcare, Varun Beverages and National Aluminium
- Top traded futures contracts: HDFC Bank, Eicher Motors, ICICI Bank, Bharti Airtel and State Bank of India
- Top traded options contracts: ADANIENT 2400 CE, EICHERMOT 5000 PE, APOLLOHOSP 6500 PE, BHARTIAIRTEL 1700 CE and ADANIENT 2360 CE
- Under F&O ban: Manappuram Finance
In Futures and Options or F&O, long build-up means an increase in Open Interest (OI) along with an increase in price, and short build-up means an increase in Open Interest(OI) along with a decrease in price. Source: Upstox and NSE.
Disclaimer: Derivatives trading must be done only by traders who fully understand the risks associated with them and strictly apply risk mechanisms like stop-losses. The information is only for consumption by the client and such material should not be redistributed. We do not recommend any particular stock, securities and strategies for trading. The securities quoted are exemplary and are not recommendatory. The stock names mentioned in this article are purely for showing how to do analysis. Take your own decision before investing.
About The Author
Next Story


