Market News
Trade Setup for Dec 6: NIFTY50 sets course for 25,000 with RBI policy looming
.png)
4 min read | Updated on December 06, 2024, 08:43 IST
SUMMARY
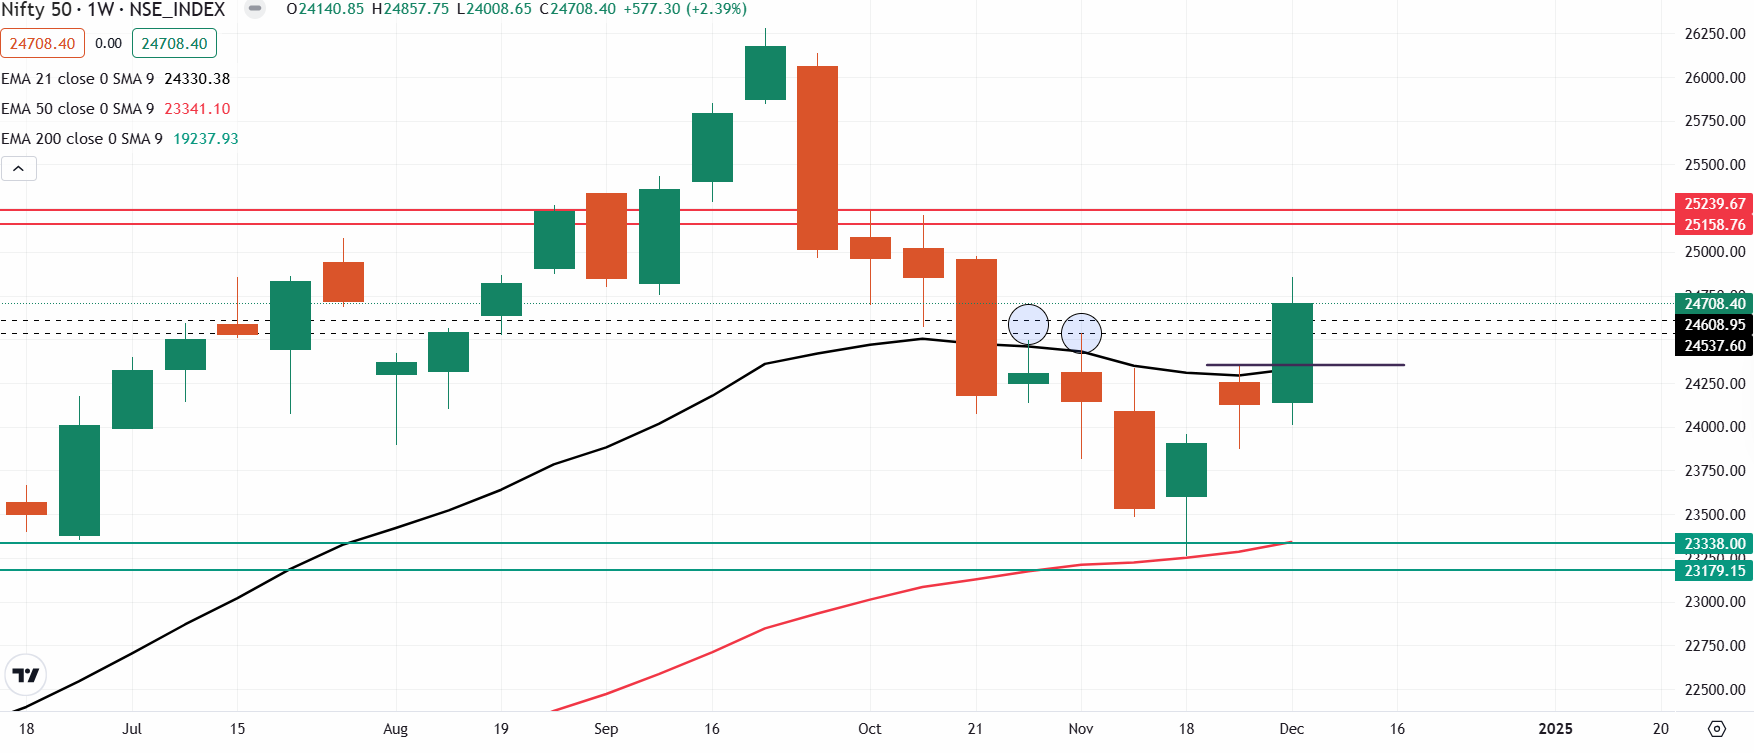
The NIFTY50 index indicates a close above the previous week’s high, signalling a continuation of the bullish sentiment. However, traders should closely monitor the index's weekly closing. A close above the high will provide further directional clues.
Stock list

The SENSEX continued its upward trajectory, closing in the green for the fifth consecutive session.
Asian markets @ 7 am
- GIFT NIFTY: 24,803 (+0.15%)
- Nikkei 225: 39,104 (-0.74%)
- Hang Seng: 19,611 (+0.26%)
U.S. market update
- Dow Jones: 44,765 (▼ 0.5%)
- S&P 500: 6,075 (▼ 0.1%)
- Nasdaq Composite: 19,700 (▼ 0.1%)
U.S. indices ended Thursday's session on a flat to negative note ahead of the release of November's jobs report. Market participants are expecting that the U.S. economy added 2,14,000 jobs in November. Meanwhile, this reading could provide guidance for the Federal Reserve's interest rate decision at its policy meeting later this month. As of Thursday, the Street is pricing in a 74% chance of a 0.25% rate cut at the December meeting, down from 77% the day before.
NIFTY50
- December Futures: 24,764 (▲0.0%)
- Open interest: 4,46,976 (▼3.2%)
The NIFTY50 index extended its winning streak to a fifth consecutive day, closing Thursday's session with a gain of nearly 1%. Despite high volatility during the weekly expiry of its options contracts, the index showcased resilience. After plunging by 1% in the first half of the session, it staged a sharp recovery, surging over 2% from the day’s low and ended the day above the previous session’s indecision candle, signaling a continuation of the bullish momentum.
For the upcoming week, the technical structure of the NIFTY50 index on the weekly time frame is providing the follow-through of the bullish momentum and is indicating a close above previous week’s high. In such a scenario, traders can closely monitor the weekly closing of the index. A close above the high will suggest continuation of the current trend, while a close below the previous week’s high may signal entry of fresh sellers at higher levels.

SENSEX:
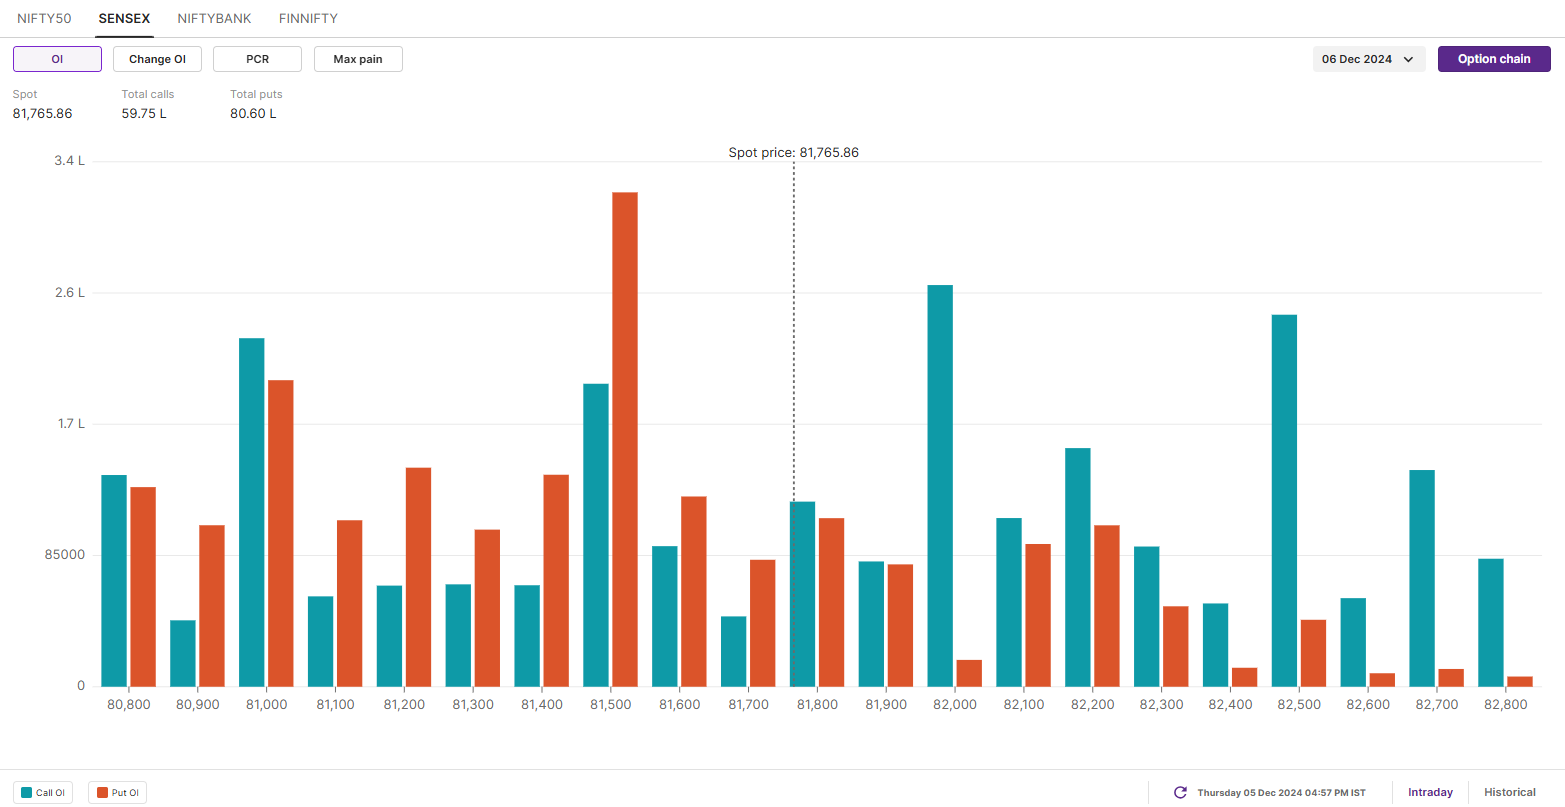
- Max call OI: 85,000
- Max put OI: 80,000
- (Expiry: 6 Dec)
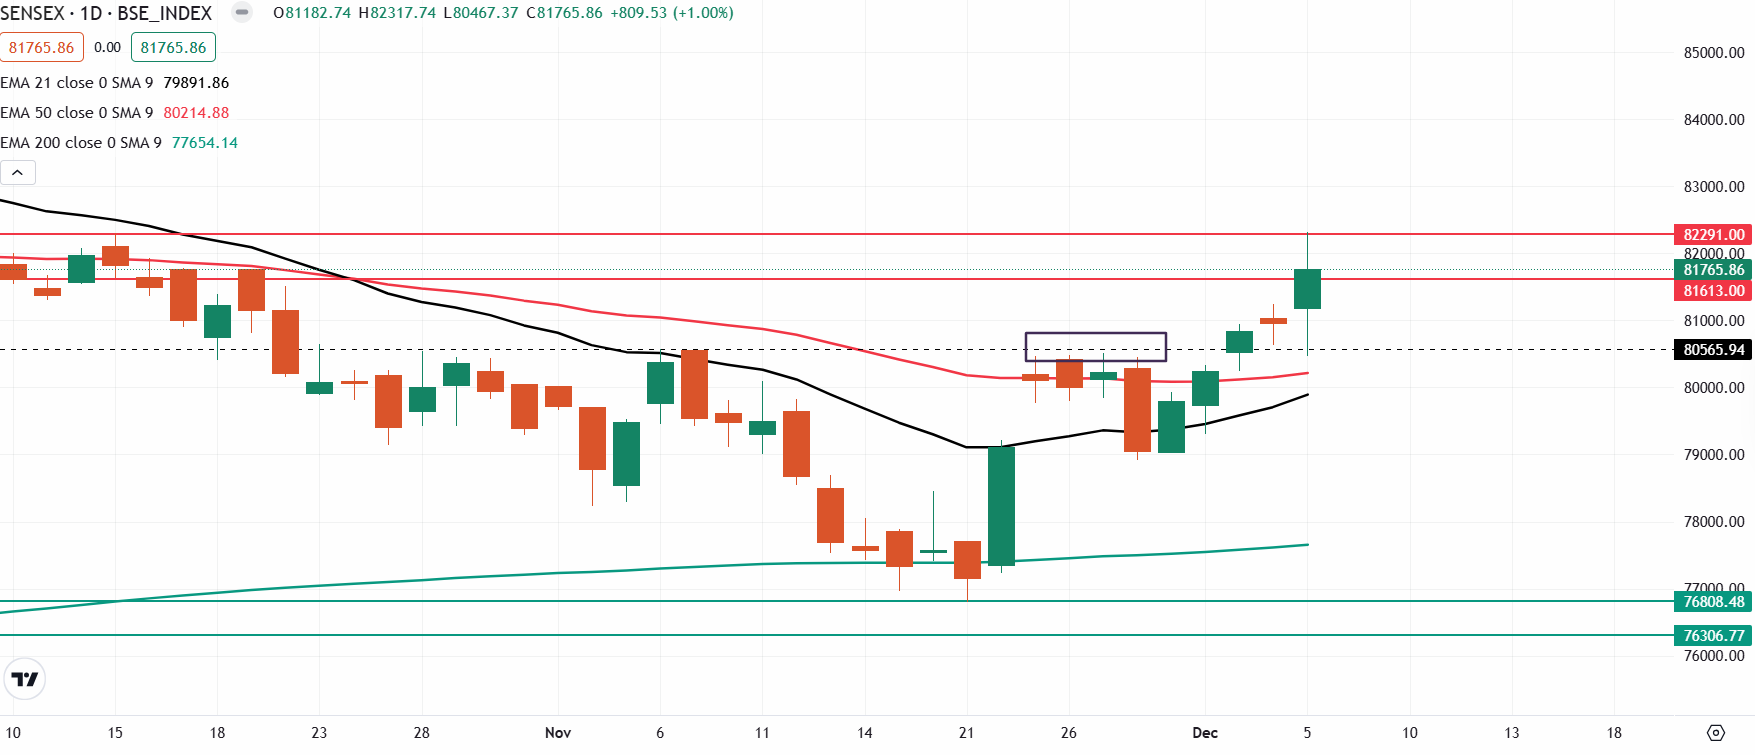
The SENSEX continued its upward trajectory, closing in the green for the fifth consecutive session. The index registered gains of over 1% and moved in a range of over 2% from the day’s low to the high, signalling sharp swings and volatility.
On the daily chart, the index closed above the high of the previous day’s indecision candle, signalling continuation of the ongoing trend. Unless the index slips below the 80,500 mark on a closing basis, the trend may remain bullish. Meanwhile, the immediate resistance is visible around the 82,300 mark.

The open interest data for today’s expiry reveals a substantial put base at the 81,000 and 81,500 strike levels, indicating strong support for the index around these zones. Conversely, a notable call base was observed at the 82,000 and 82,500 strikes, establishing these levels as key resistance zones for the index.

FII-DII activity
Stock scanner
- Long build-up: BSE, CDSL, Angel One, Max Healthcare and Tata Elxsi
- Short build-up: Divi’s Laboratories and Oil India
- Under F&O ban: Granules India, Manappuram Finance and RBL Bank
In Futures and Options or F&O, long build-up means an increase in Open Interest (OI) along with an increase in price, and short build-up means an increase in Open Interest(OI) along with a decrease in price. Source: Upstox and NSE.
Derivatives trading must be done only by traders who fully understand the risks associated with them and strictly apply risk mechanisms like stop-losses. The information is only for consumption by the client and such material should not be redistributed. We do not recommend any particular stock, securities and strategies for trading. The securities quoted are exemplary and are not recommendatory. The stock names mentioned in this article are purely for showing how to do analysis. Take your own decision before investing.
About The Author
Next Story

