Market News
Trade Setup for Dec 30: NIFTY50 hovers around 200 EMA, faces resistance around 24,000
.png)
4 min read | Updated on December 30, 2024, 08:06 IST
SUMMARY
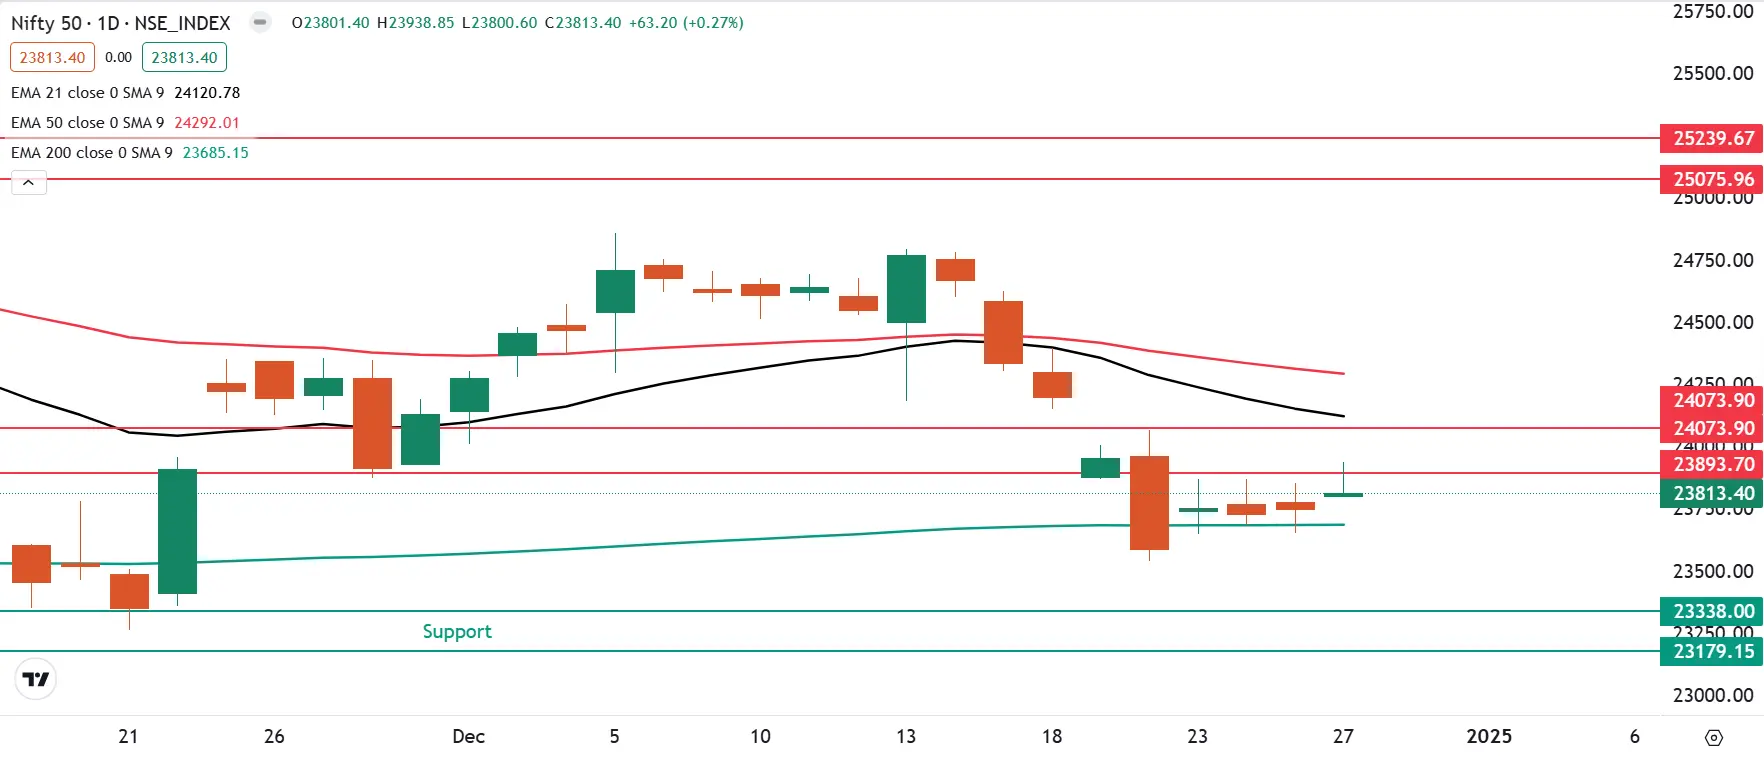
The NIFTY50 index is consolidating within the December 20 range and has formed four inside candles on the daily chart. Unless the index breaks this range on a closing basis, the trend may remain sideways.

Asian markets @ 7 am
- GIFT NIFTY: 23,986.00 (+0.11%)
- Nikkei 225: 40,040.83 (-0.60%)
- Hang Seng: 20,116.88 (+0.13%)
U.S. market update
- Dow Jones: 42,992 (▼0.7%)
- S&P 500: 5,970 (▼1.1%)
- Nasdaq Composite: 19,722 (▼1.4%)
U.S. indices ended the Friday’s session on a negative note, with all the three indices ending in the red in the holiday-shortened week. The sharp sell-off was led by decline in heavyweight technology stocks.
Despite Friday’s drop, the S&P500 is on track for a gain of around 25% in 2024, marking second consecutive yearly gain of over 20%, for the first time since 1977-1998.
NIFTY50
- January Futures: 23,992 (▲0.3%)
- Open interest: 4,67,810 (▲4.7%)
The NIFTY50 index attempted to break the three day consolidation on Friday and faced resistance around the 24,000 zone. The index extended its range-bound movement for the fourth day in a row within the range of 20 December’s candle.
On the daily chart, the index is facing resistance between the 23,900 and 24,000 zone, which coincides with the high of the 20 December’s candle. On the other hand, the support lies at the 200 day exponential moving average. A break of this range on a closing basis will provide further directional clues.

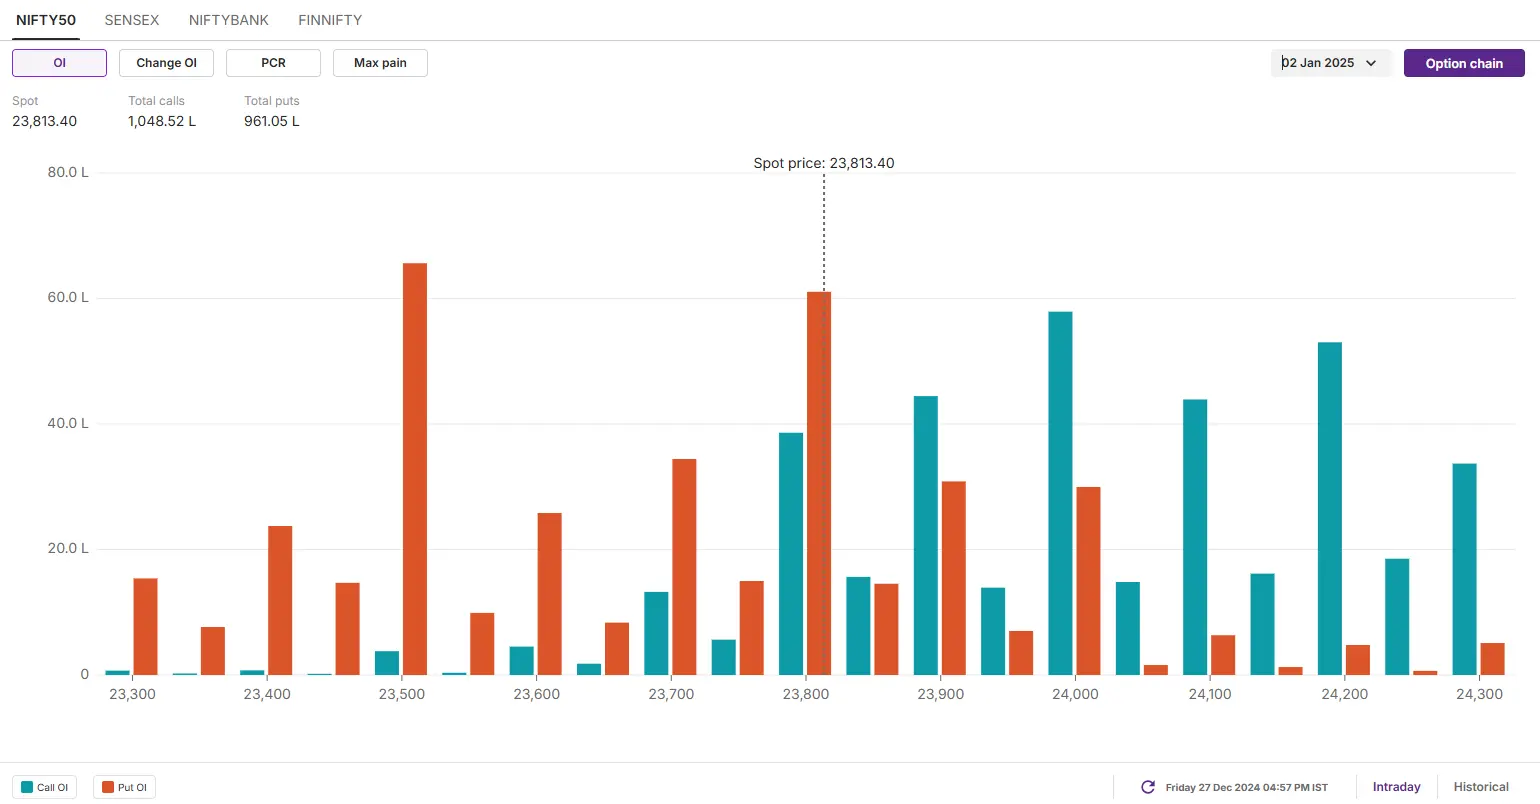
The open interest data for the 2 January expiry saw significant call options base at 24,000 and 24,200 strikes, suggesting resistance for the index around this zone. On the other hand, the put base was seen at 23,500 and 23,800 strike, indicating support for the index around these levels.

SENSEX
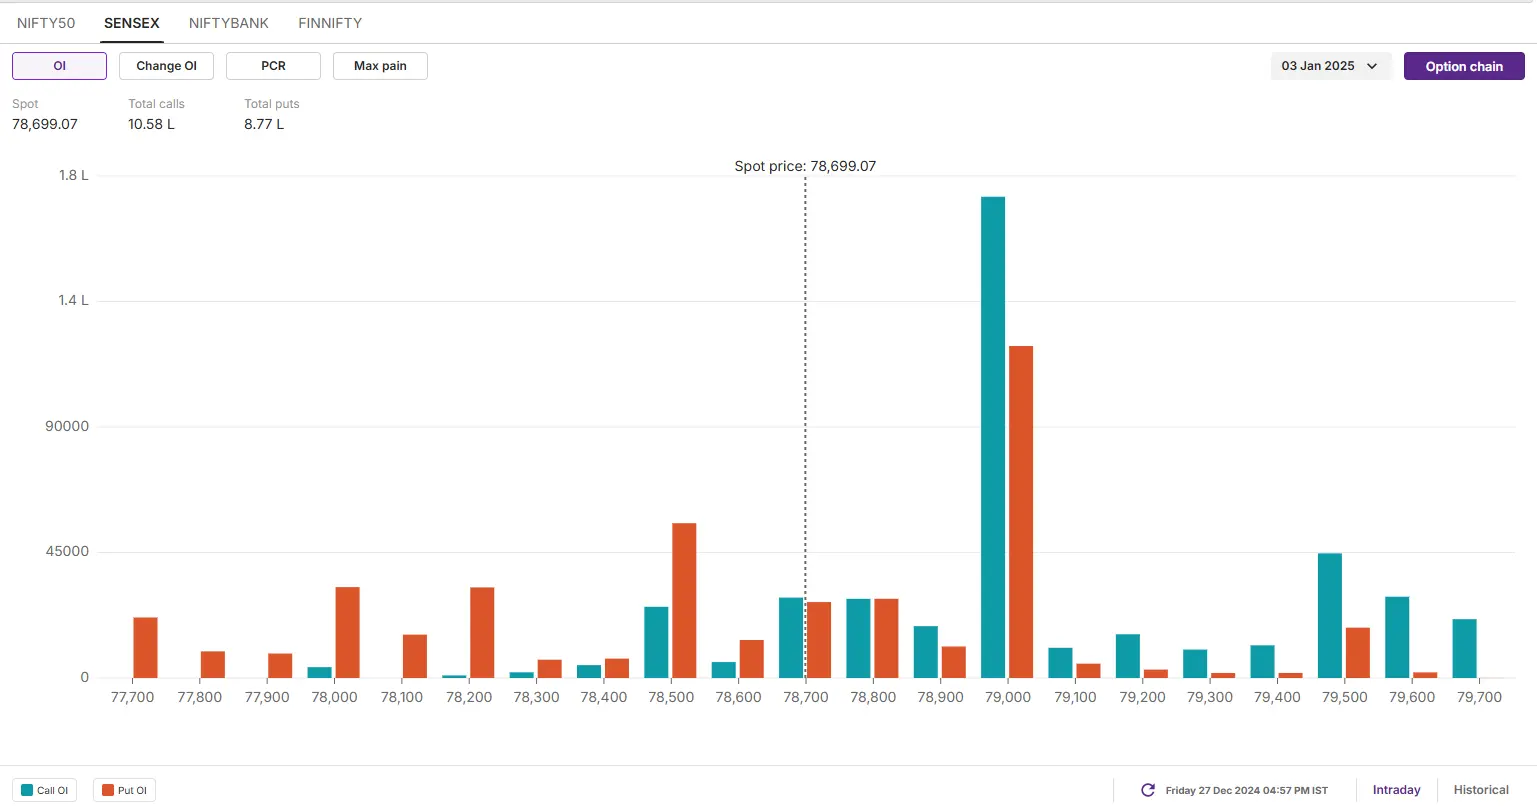
- Max call OI: 79,000
- Max put OI: 79,500
- (Expiry: 3 Jan)
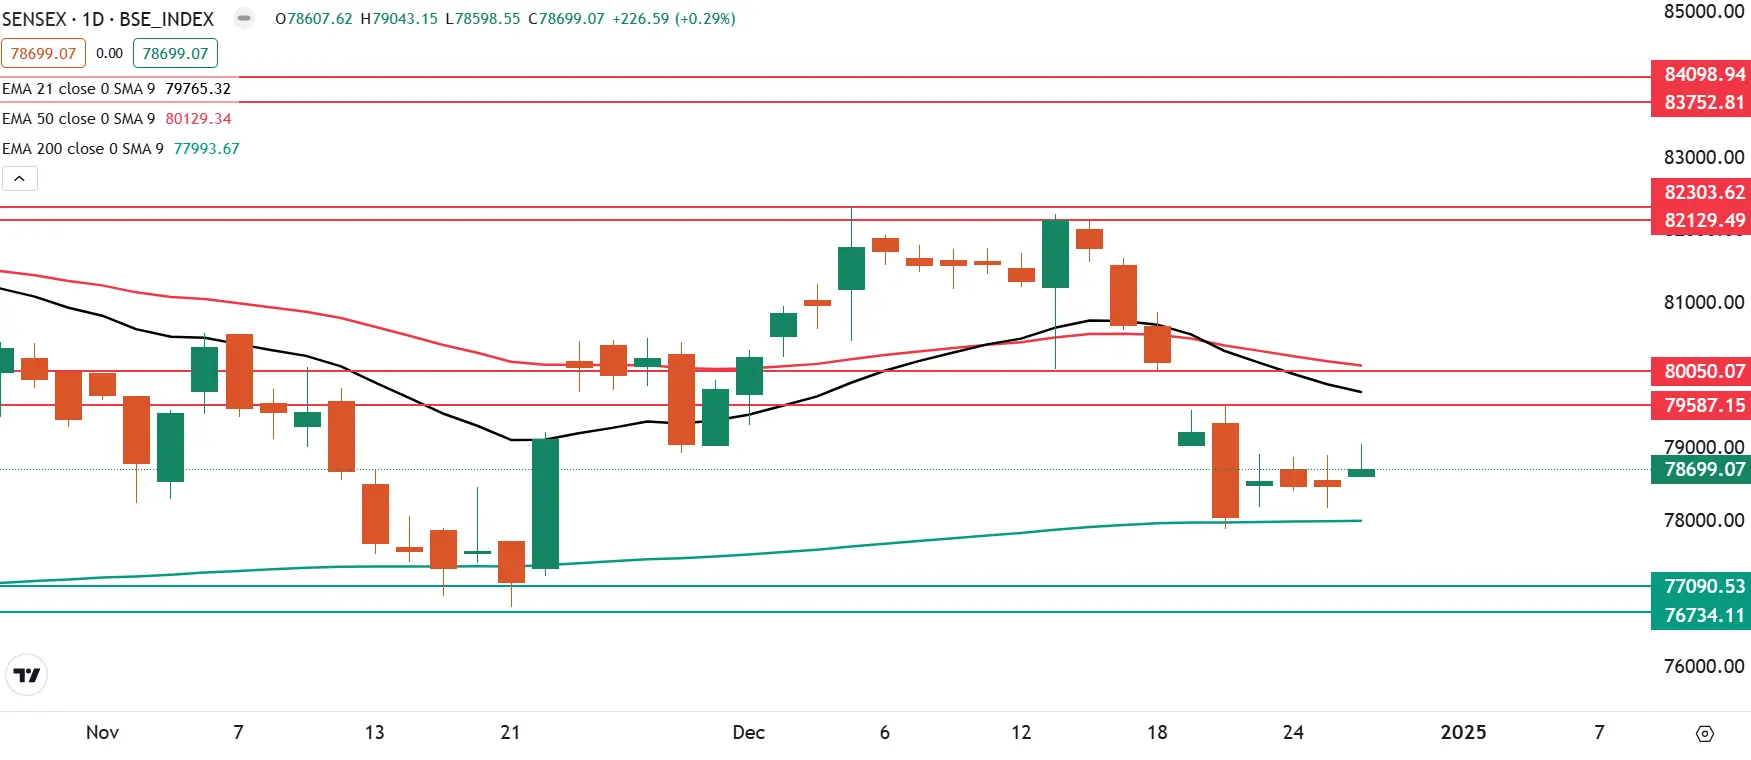
The SENSEX also extended the range-bound movement for the fourth day in a row and ended the Friday’s session on a positive note. The index is currently trading above its 200 day exponential moving average (EMA) and is protecting the psychologically crucial level on a closing basis.
From the technical standpoint, the index has immediate resistance around the 79,500 and 80,000 zone which also coincides with the 20 and 50 EMAs. On the flip side, the immediate support for the index is around 200 EMA. Unless the index breaks this range on a closing basis, the trend may remain sideways.

The open interest data for the 3 January expiry remains consolidated at the 79,000 strike. The index saw the highest build-up of both call and put options around this level, indicating consolidation around this zone.

FII-DII activity
Stock scanner
- Long build-up: Dr. Reddy’s Laboratories, Escorts Kubota and IPCA Laboratories
- Short build-up: NMDC, RBL Bank, HFCL and NHPC
- Under F&O ban: Nil
In Futures and Options or F&O, long build-up means an increase in Open Interest (OI) along with an increase in price, and short build-up means an increase in Open Interest(OI) along with a decrease in price. Source: Upstox and NSE.
Disclaimer: Derivatives trading must be done only by traders who fully understand the risks associated with them and strictly apply risk mechanisms like stop-losses. The information is only for consumption by the client and such material should not be redistributed. We do not recommend any particular stock, securities and strategies for trading. The securities quoted are exemplary and are not recommendatory. The stock names mentioned in this article are purely for showing how to do analysis. Take your own decision before investing.
About The Author
Next Story

