Market News
Trade Setup for Dec 18: NIFTY50 reverses Friday’s momentum as Fed meeting looms
.png)
5 min read | Updated on December 18, 2024, 07:23 IST
SUMMARY
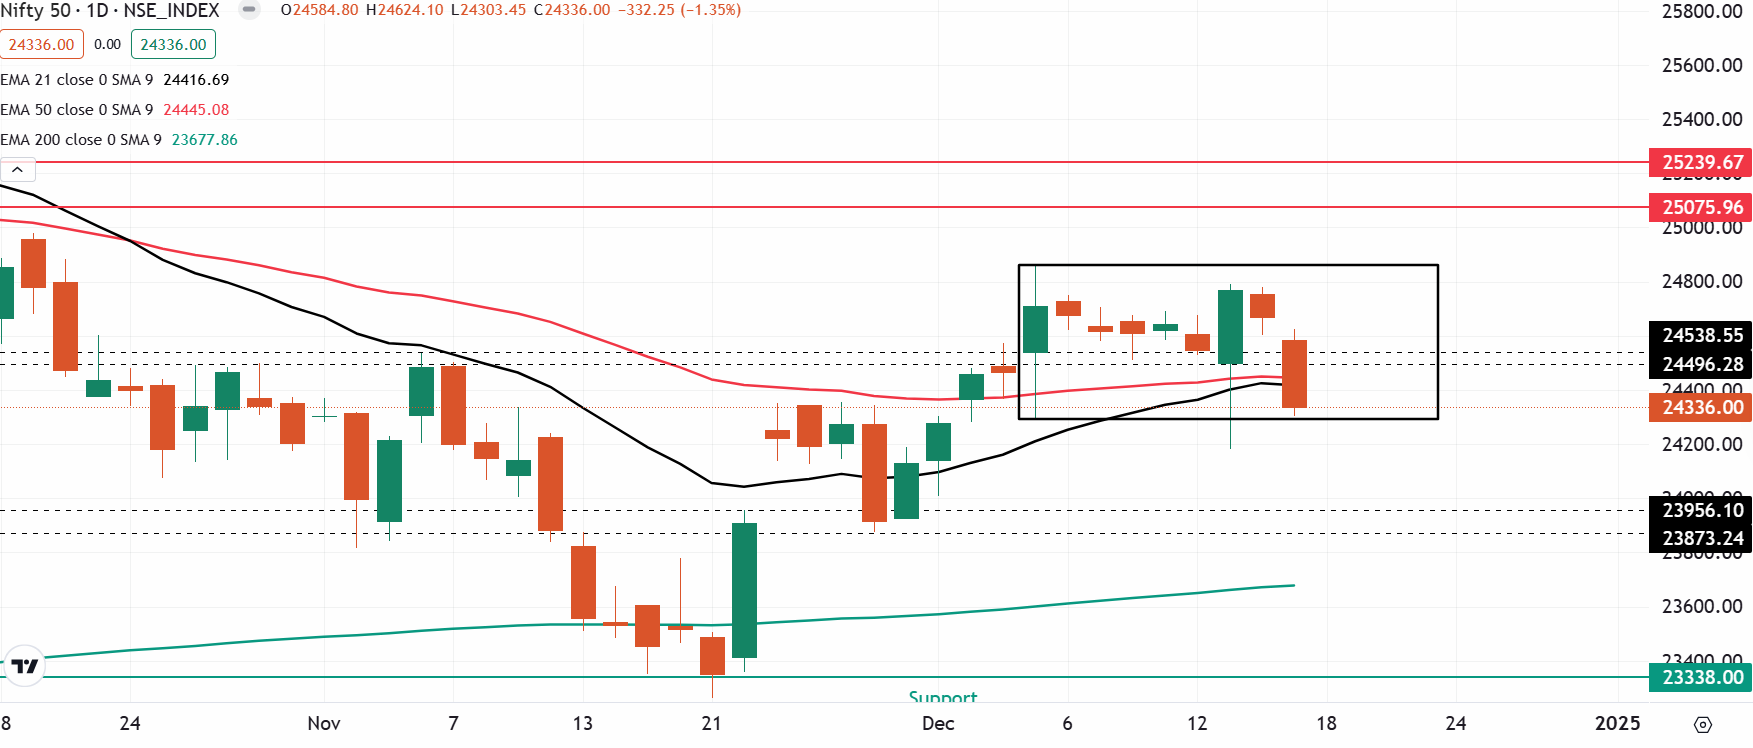
Ahead of the outcome of the Federal Reserve's meeting later today, the 24,200 level, last Friday's low, and the 24,000 level are expected to act as key support zones for the NIFTY50. On the other hand, the 24,700-24,800 area will act as a critical resistance zone on the upside.
Stock list

The NIFTY50 index reversed Friday’s gains and extended the losing streak for the second consecutive session on Tuesday.
Asian markets @ 7 am
- GIFT NIFTY: 24,364.50 (-0.27%)
- Nikkei 225: 39,342.36 (-0.06%)
- Hang Seng: 19,884.54 (+0.93%)
U.S. market update
- Dow Jones: 43,449 (▼0.6%)
- S&P 500: 6,050 (▼0.3%)
- Nasdaq Composite: 20,109 (▼0.3%)
U.S. indices ended Tuesday's session in the red with Dow Jones extending the losses for the ninth consecutive day, its longest losing streak since 1978. Meanwhile, the S&P 500 and Nasdaq Composite also came under selling pressure but fared better than the Dow, which was weighed down by healthcare stocks and the recent sell-off in Nvidia.
On the other hand, the investors also accessed the Retail sales data of November which increased 0.7%, which was higher than the street estimates of 0.6%. Moreover, the reading of October was also revised up to 0.5% from 0.4%.
Amid the strong retail sales data, investors will be looking for an update on the Federal Reserve's outlook for the U.S. economy. The Federal Open Market Committee (FOMC) meeting, which began on Tuesday, is expected to cut interest rates by 25 basis points. Investors will be monitoring the latest summary of the central bank's economic projections, as well as Fed Chair Jerome Powell's remarks during the press conference later in the evening.
NIFTY50
- December Futures: 24,417 (▼1.3%)
- Open interest: 4,42,621 (▲1.7%)
The NIFTY50 index reversed Friday’s gains and extended the losing streak for the second consecutive session on Tuesday. The index has fallen nearly 2% from its Friday’s peak ahead of the outcome of the U.S. Federal Reserve’s policy meeting which will be released today later in the evening.
The index witnessed sharp volatility ahead in the last two trading sessions with the volatility index rising over 12%. As a result, the index witnessed sharp swings and expanded its average trading range. Currently, the index is consolidating within the range of 5 December’s candle and is witnessing sharp intraday volatility. Traders can monitor the high and the low of 5 December’s candle. A close above or below these levels on the daily chart will provide further directional clues.

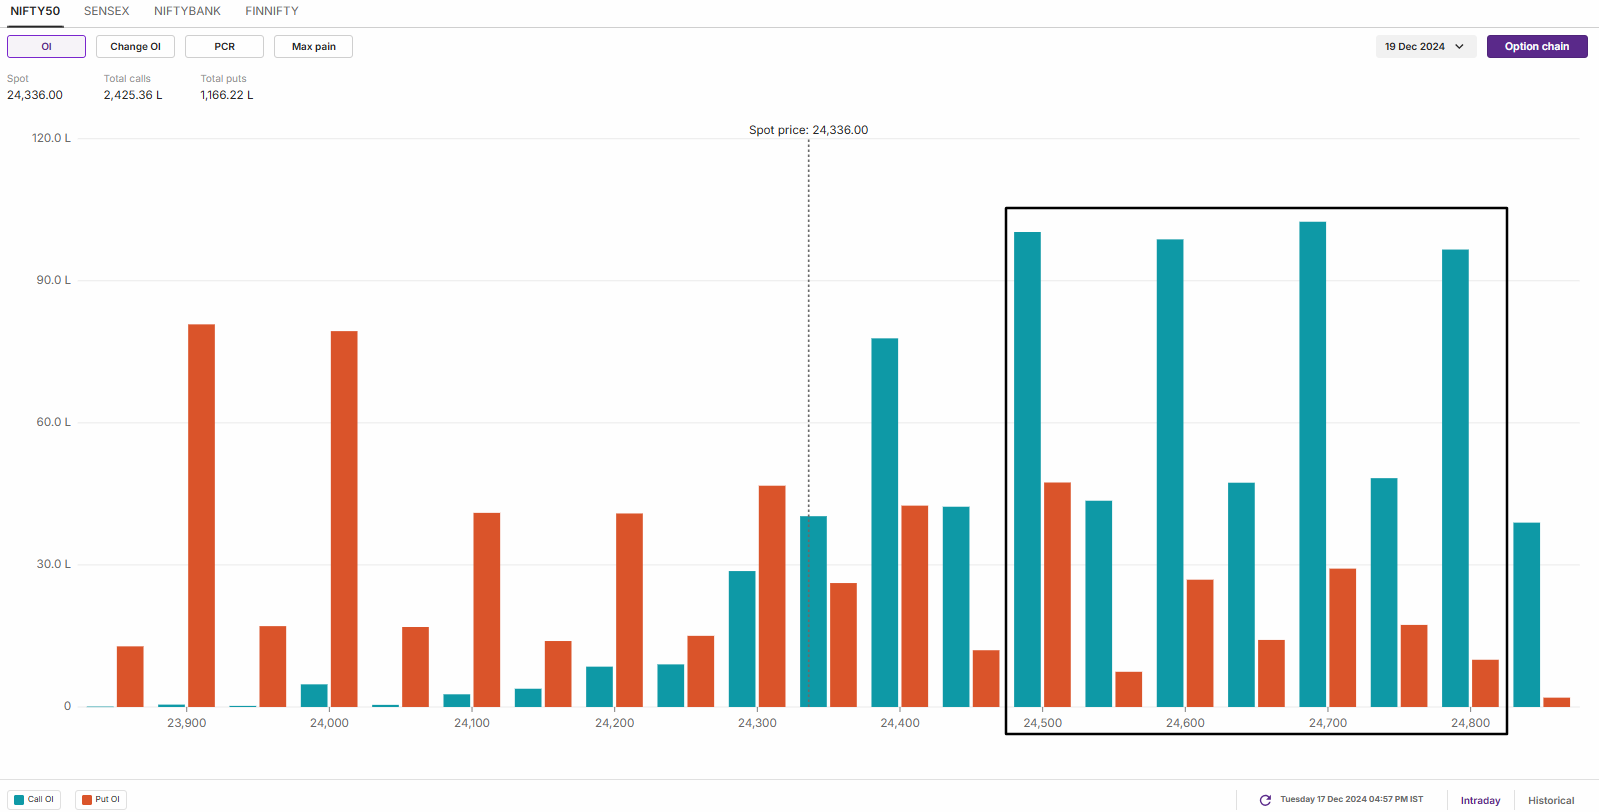
The open interest data for the 19 December expiry saw significant call base build-up from 24,500 to 24,800 strikes, indicating arrival of fresh sellers from higher levels. As per the options data, the 24,700 and 24,800 zone may act as immediate resistance for the index. Conversely, the put base remained at 24,000 and additions were seen at 23,900 strike, suggesting support for the index around these levels.

SENSEX
- Max call OI: 86,000
- Max put OI: 81,000
- (Expiry: 20 Dec)
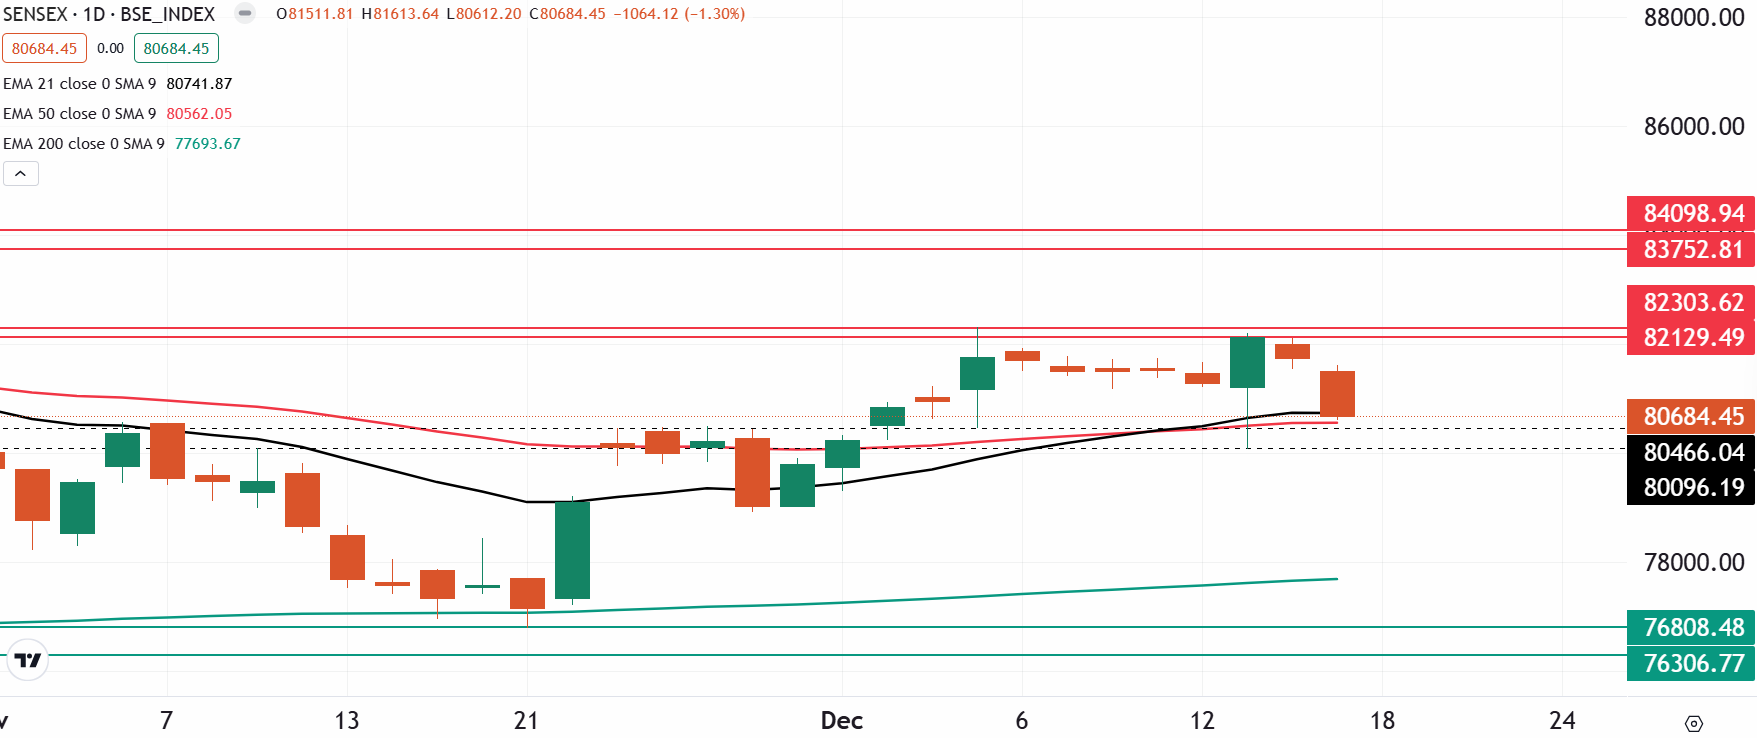
The SENSEX also came under selling pressure and slipped below the low of the inside candle in the first hour of the trading session, ending the second consecutive session on a negative note.
The technical structure of the SENSEX as per the daily chart turned sideways to bearish as the index surrendered Friday’s gains and surrendered the 21 day exponential moving average on closing basis. For the upcoming sessions, traders can monitor the price action around the previous week’s low of 80,000 zone. A close below this zone on a closing basis, will signal more weakness. Meanwhile, the resistance of the index remains around 82,300 zone.

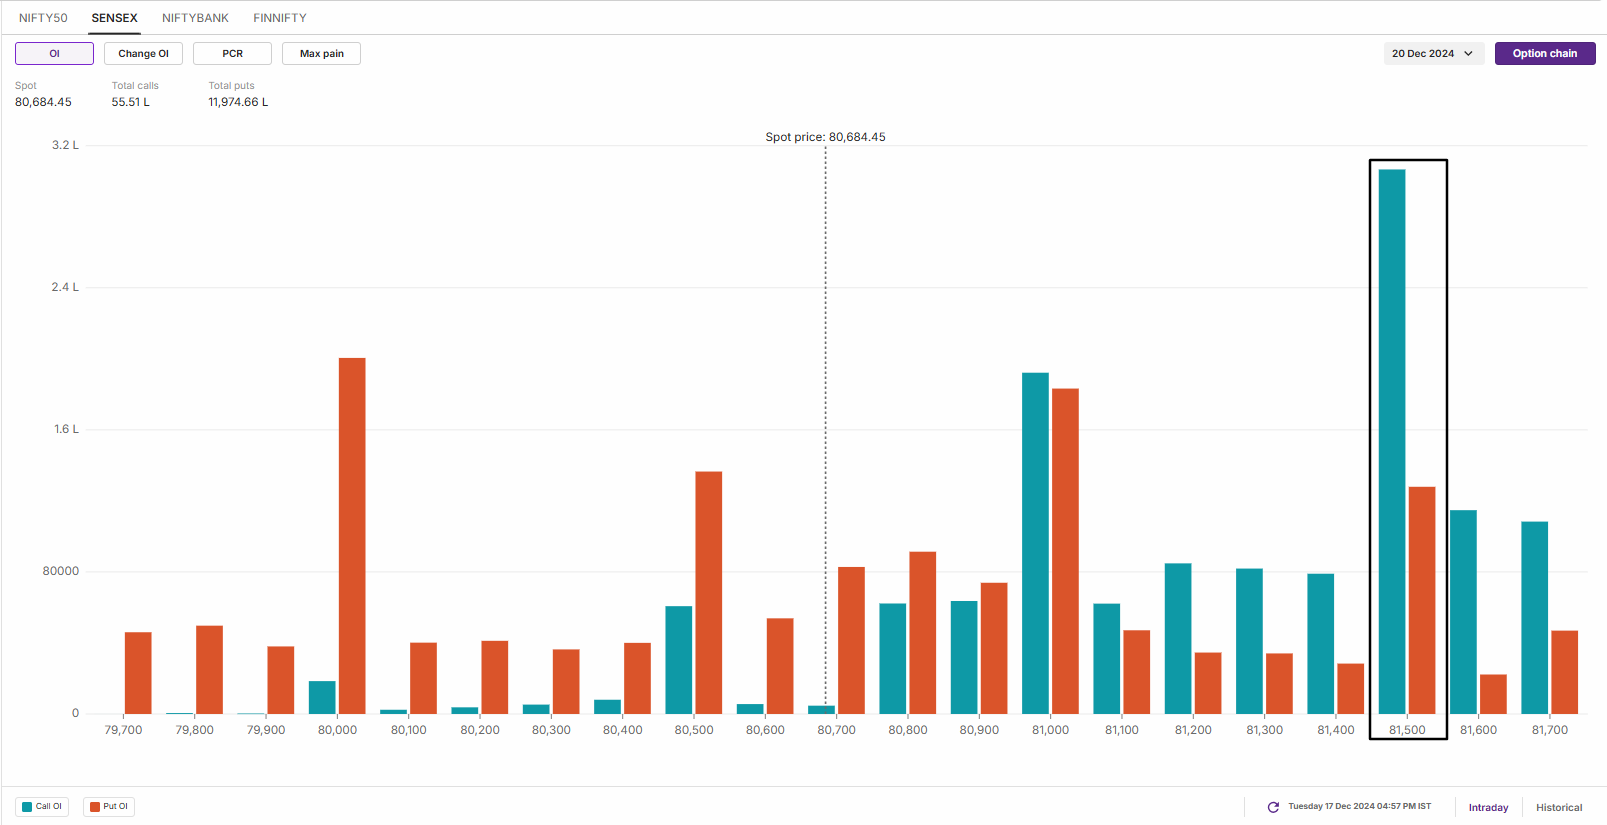
The open interest data for the 20 December expiry saw a significant call base at 81,500 strike, pointing at resistance for the index around this zone. On the other hand, the put base shifted to 80,000 strike, suggesting support for the index around this zone.

FII-DII activity
Stock scanner
- Long build-up: United Spirits, Nykaa and Max Healthcare
- Short build-up: Dr. Reddy’s Laboratories, Oil India, Pidilite Industries, Bandhan bank, TVS Motor and Escorts Kubota
- Under F&O ban: Bandhan Bank, Chambal Fertilisers, Granules India, Hindustan Copper, Manappuram Finance, National Aluminium, PVR Inox, RBL Bank and Steel Authority of India
- Added under F&O ban: Bandhan Bank, Chambal Fertilisers and PVR Inox
In Futures and Options or F&O, long build-up means an increase in Open Interest (OI) along with an increase in price, and short build-up means an increase in Open Interest(OI) along with a decrease in price. Source: Upstox and NSE.
Disclaimer: Derivatives trading must be done only by traders who fully understand the risks associated with them and strictly apply risk mechanisms like stop-losses. The information is only for consumption by the client and such material should not be redistributed. We do not recommend any particular stock, securities and strategies for trading. The securities quoted are exemplary and are not recommendatory. The stock names mentioned in this article are purely for showing how to do analysis. Take your own decision before investing.
About The Author
Next Story

