Market News
Trade Setup for Dec 12: NIFTY50 consolidates around 24,600, forms third inside candle in a row
.png)
4 min read | Updated on December 12, 2024, 07:16 IST
SUMMARY
The NIFTY50 index appears poised for a breakout following its current consolidation phase. In the near term, the 24,700 level is acting as a resistance, with 25,000 emerging as a significant hurdle. On the downside, 24,500 serves as an immediate support level; a breach below this mark could trigger increased selling pressure on the index.
Stock list
Asian markets @ 7 am
- GIFT NIFTY: 24,748.50 (+0.06%)
- Nikkei 225: 39,970.46 (+1.52%)
- Hang Seng: 20,213.24 (+0.29%)
U.S. market update
- Dow Jones: 44,148 (▼0.2%)
- S&P 500: 6,084 (▲0.8%)
- Nasdaq Composite: 20,034 (▲1.7%)
U.S. indices ended the Wednesday’s session on a mixed note with Nasdaq Composite crossing the 20,000 mark for the first time. This comes after the November’s inflation report came in line with the street expectations. The Consumer Price of Index rose 2.7% YoY, a slight uptick from October’s 2.6% reading. Meanwhile, the technology stocks lifted the market sentiment with Google, Nvidia and Tesla surging in the range of 3% to 5%.
NIFTY50
- December Futures: 24,734 (▲0.2%)
- Open interest: 4,45,929 (▼0.7%)
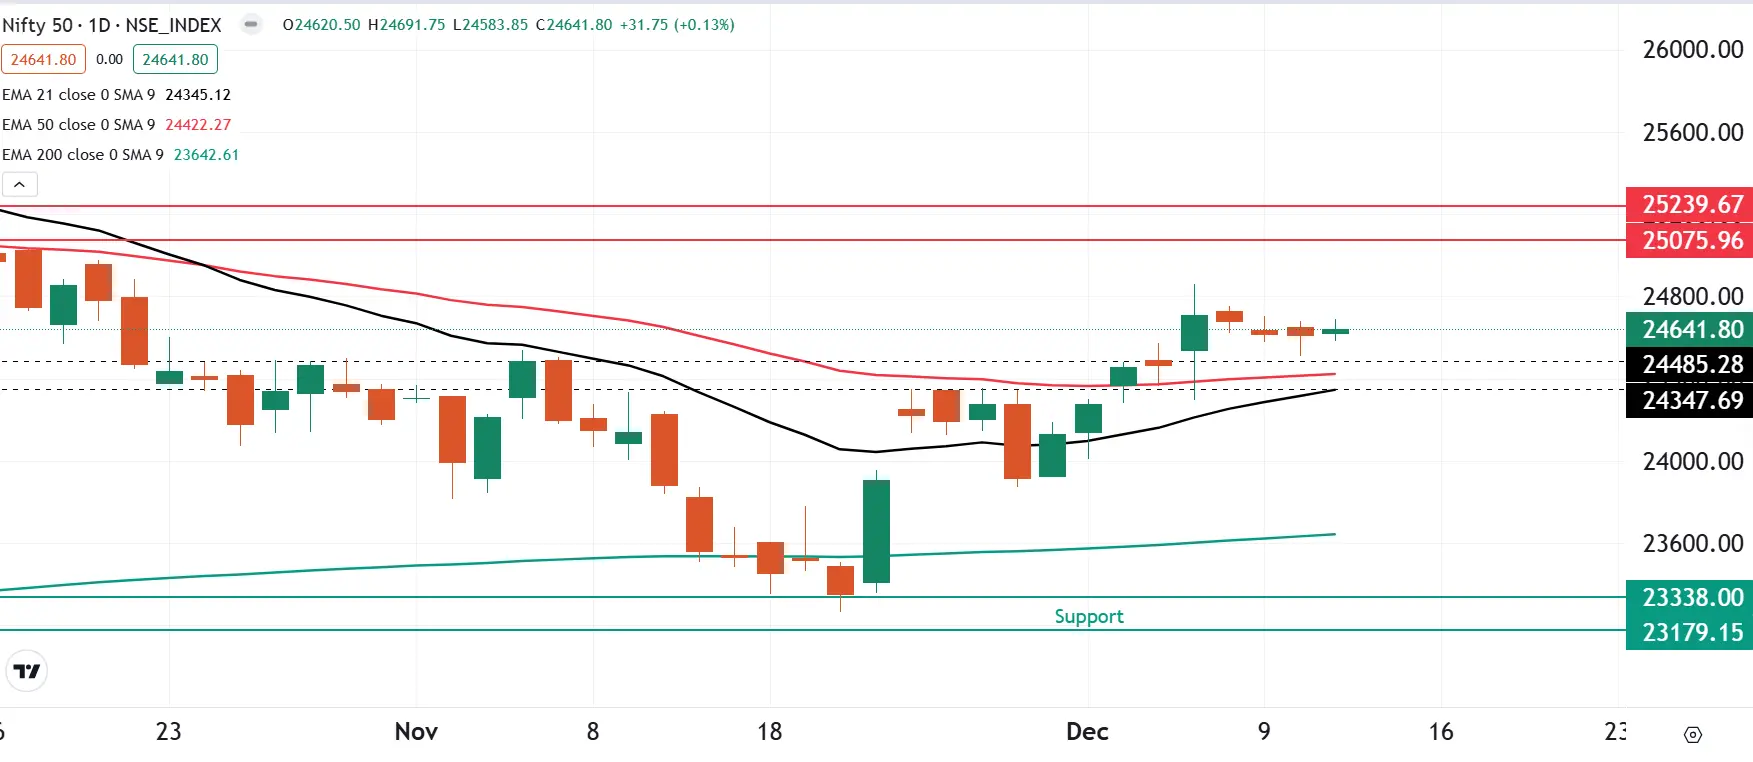
The NIFTY50 index extended the sideways movement for the fourth consecutive day forming yet another inside candle on the daily chart. It failed to close above the high of the hammer candlestick pattern formed on 10 December, indicating presence of the sellers at the higher levels.
On the daily chart, the NIFTY50 index has been consolidating around the 24,600 mark for the past three days with immediate support around the 24,500 and 24,300 zone. On the other hand, the resistance for the index remains at 24,850. A break of this range will provide further directional clues.
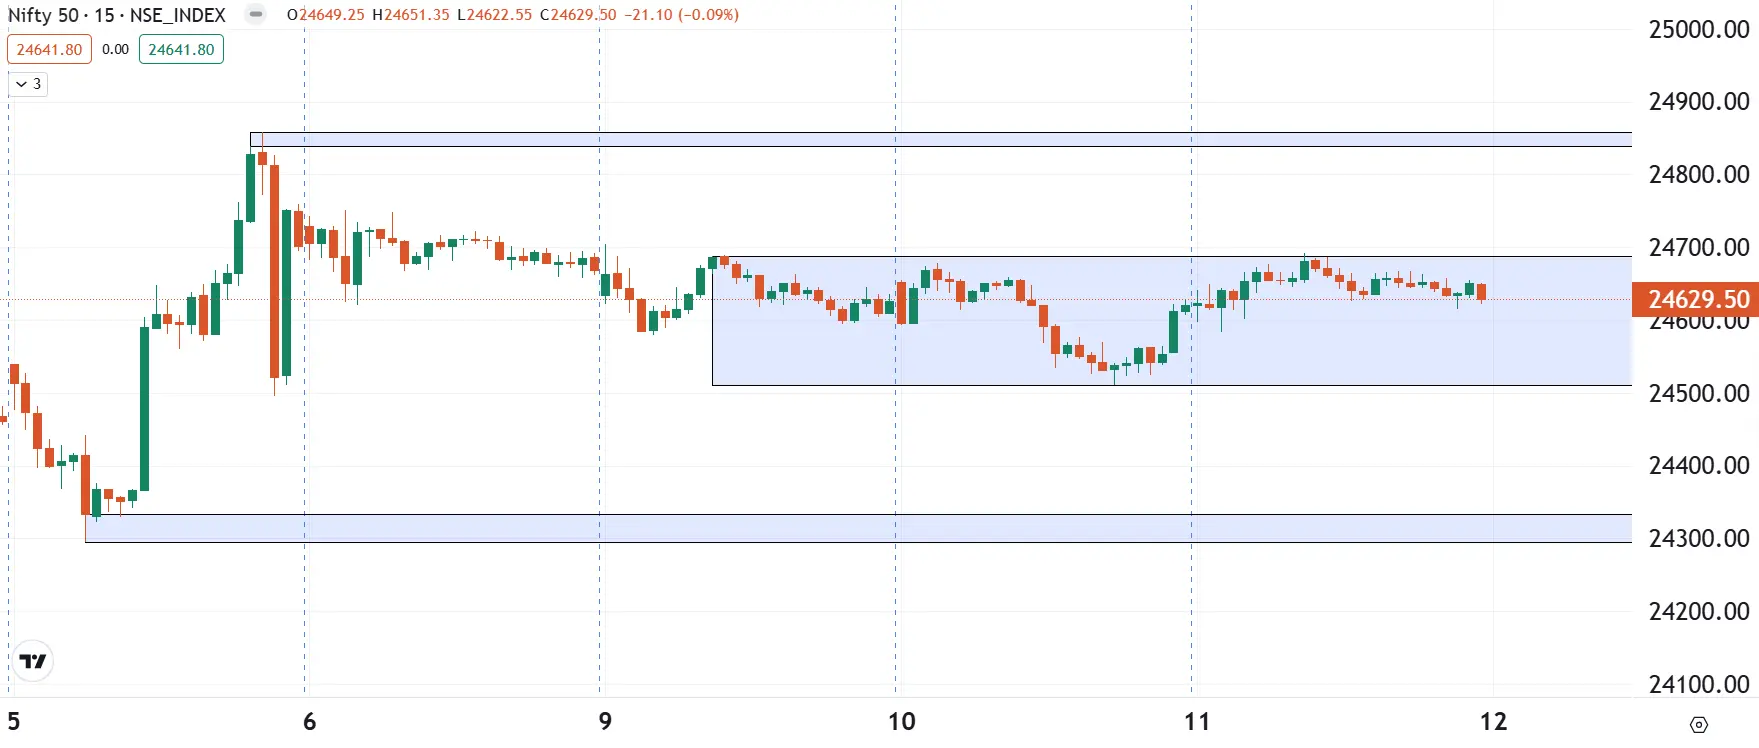
The structure of the index on the 15-minute chart remains range-bound between 24,700 and 24,500 zones. The index has been consolidating broadly within this 200 point range for the past three sessions and a break of this range may provide short-term directional clues.
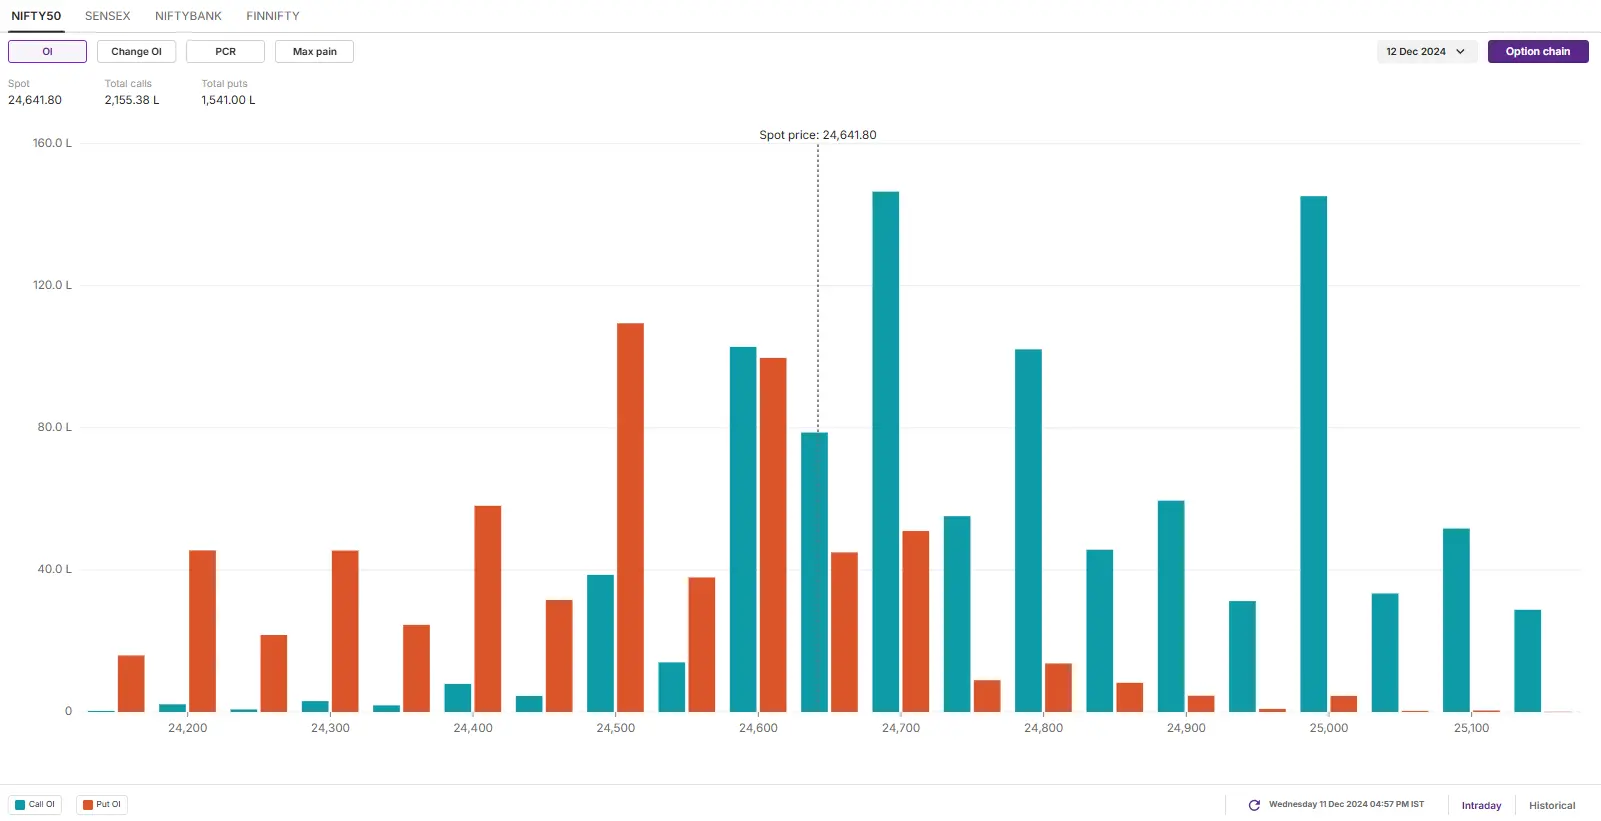
The open interest (OI) data for today’s weekly expiry of NIFTY50 saw significant call OI base at 25,000 and 24,700 strikes, suggesting resistance for the index around these levels. On the flip side, the put base was seen at 24,000 and 24,500 strikes, pointing at support for the index around these strikes.
SENSEX
- Max call OI: 84,000
- Max put OI: 81,500
- (Expiry: 13 Dec)
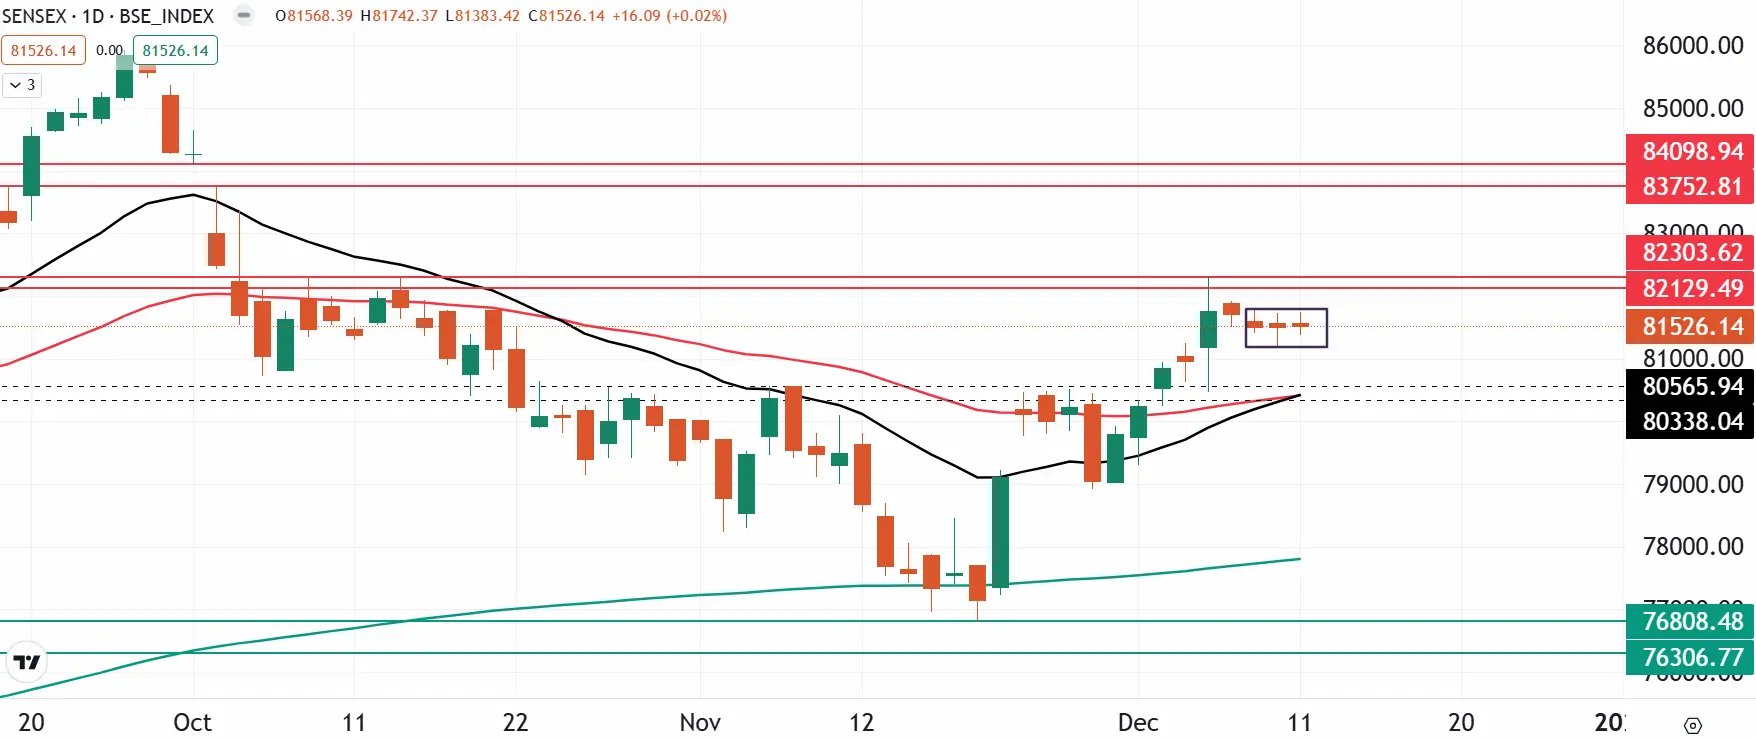
The SENSEX also extended the sideways movement for the third day in a row and ended the 10 December’s session around the 81,500 zone. The index formed the third consecutive doji candlestick pattern on the daily chart, indicating indecision around current levels.
As shown on the chart below, the index is currently trading in a narrow range of broadly 500 points range and is currently consolidating around 81,500 with immediate support around the 21 and 50 day exponential moving averages (EMAs). Conversely, the resistance for the index is around 82,300 zone. A break of this range may provide further directional clues.
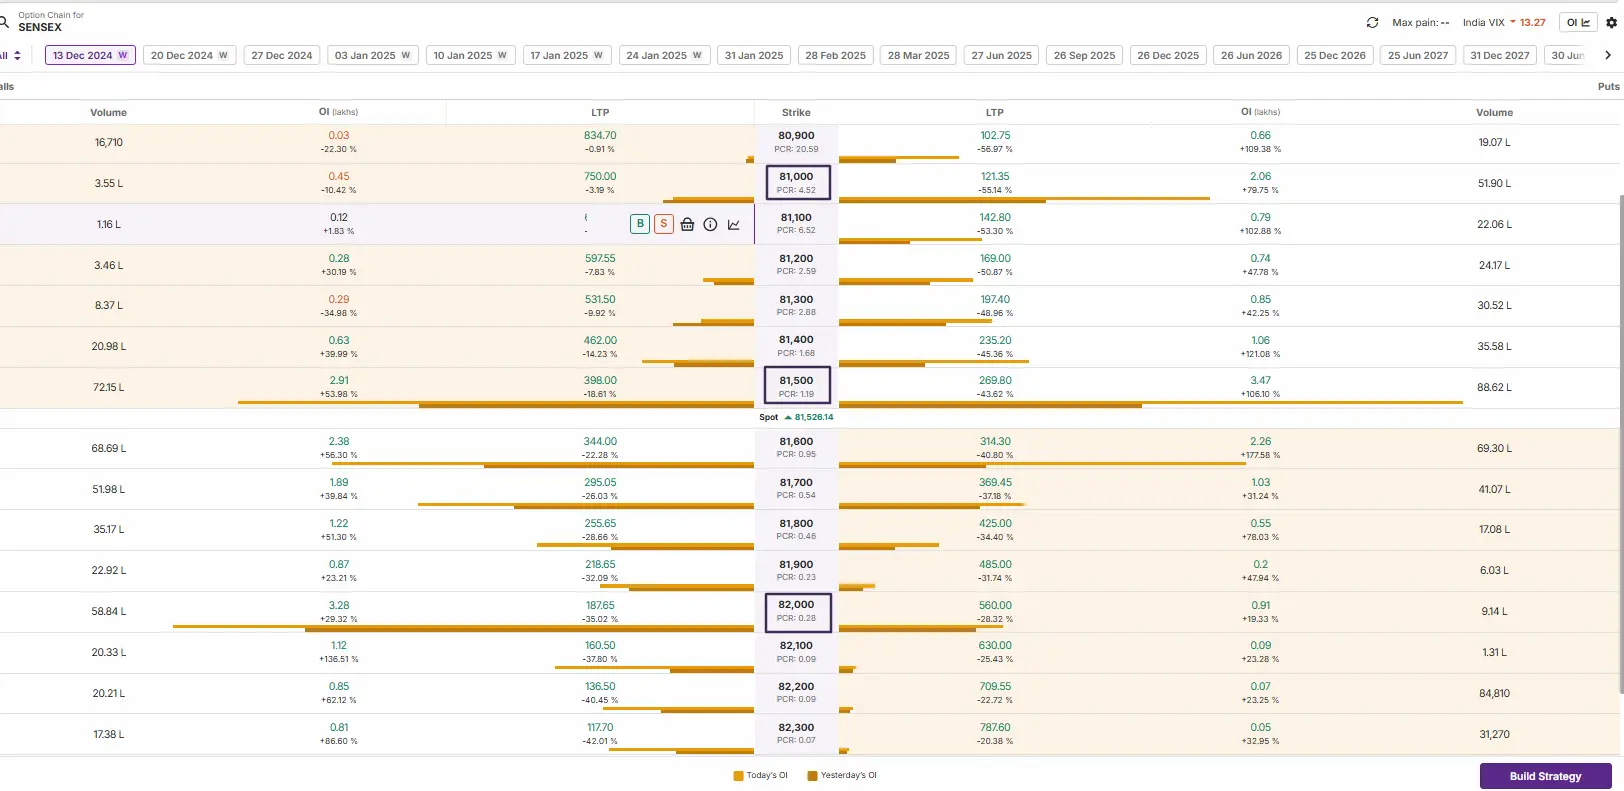
The open interest data for the 13 December expiry saw significant call base at 82,000 and put base was seen at 81,000 strike, suggesting immediate resistance and support for the index around these levels. Meanwhile, a substantial call and put base was seen at 81,500 strike, indicating consolidation around this level.
FII-DII activity
Stock scanner
- Long build-up: Max Healthcare, IRFC, Tata Communications, Dalmia Bharat and BSE
- Short build-up: Avenue Supermarts, NCC and FSN E-Commerce (Nykaa)
- Under F&O ban: Granules India, Hindustan Copper, Manappuram Finance, PVR Inox, Metropolis and RBL Bank
- Added under F&O ban: Hindustan Copper
In Futures and Options or F&O, long build-up means an increase in Open Interest (OI) along with an increase in price, and short build-up means an increase in Open Interest(OI) along with a decrease in price. Source: Upstox and NSE.
Disclaimer: Derivatives trading must be done only by traders who fully understand the risks associated with them and strictly apply risk mechanisms like stop-losses. The information is only for consumption by the client and such material should not be redistributed. We do not recommend any particular stock, securities and strategies for trading. The securities quoted are exemplary and are not recommendatory. The stock names mentioned in this article are purely for showing how to do analysis. Take your own decision before investing.
About The Author
Next Story

