Market News
Trade Setup for Oct 4: BANK NIFTY to confirm shooting star on weekly chart?
.png)
4 min read | Updated on October 04, 2024, 07:58 IST


SUMMARY
BANK NIFTY is showing early signs of confirming a bearish shooting star candlestick pattern that formed last week. The pattern typically signals a potential trend reversal and indicates further weakness.

NIFTY50 & SENSEX broke 20-SMA on daily basis on Thursday
Asian markets update
The GIFT NIFTY is down 0.4%, indicating a gap-down start for the NIFTY50 for the third consecutive day. Meanwhile, Asian indices are trading mixed. Japan’s Nikkei 225 is up 0.1%, while Hong Kong’s Hang Seng index is down 1.2%
U.S. market update
Dow Jones: 42,011 (▼0.4%) S&P 500: 5,699 (▼0.1%) Nasdaq Composite: 17,918 (▼0.0%)
U.S. stocks extended the losses for the second day as the tensions in the middle east kept investors on the edge. The Brent Crude and West Texas Intermediate (WTI) surged over 3% after reports emerged that Israel may target Iran’s oil facilities.
Meanwhile, the investors are keenly waiting for the payrolls report of September which will be released later today. The market participants are anticipating that the U.S. added 1,40,00 jobs in September, slightly lower than August and the Unemployement rate held steady at 4.2%.
NIFTY50
October Futures: 25,475 (▼1.8%) Open Interest: 5,33,685 (▼8.0%)
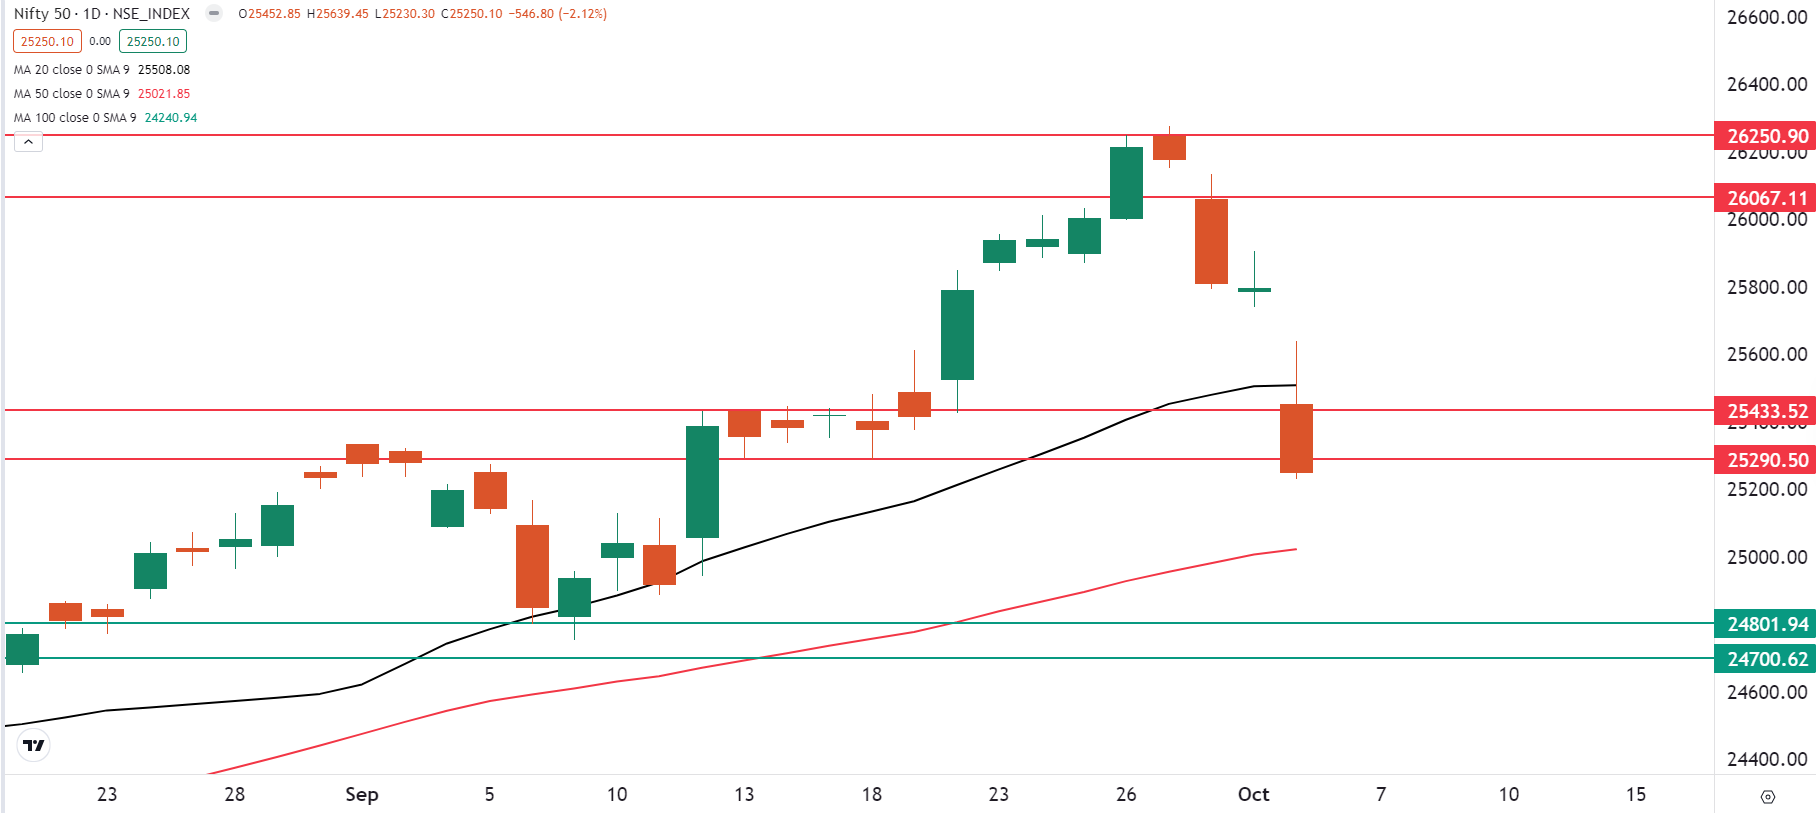
The NIFTY50 index fell over 2% on the weekly options expiry, breaking through key support levels and short-term moving averages. The decline was driven by escalating geopolitical tensions between Israel and Iran, a surge in crude oil prices and SEBI's directive to implement measures to curb excessive F&O trading.
The technical structure of the index on the daily chart has turned bearish as it surrendered the 20-day moving average on closing basis. For the upcoming sessions, the index has immediate support between 24,700 and 24,800 zone, while the 26,000 to 26,250 area will act as immediate resistance.
BANK NIFTY
October Futures: 53,381 (▼1.8%) Open Interest: 1,63,019 (▲25.1%)
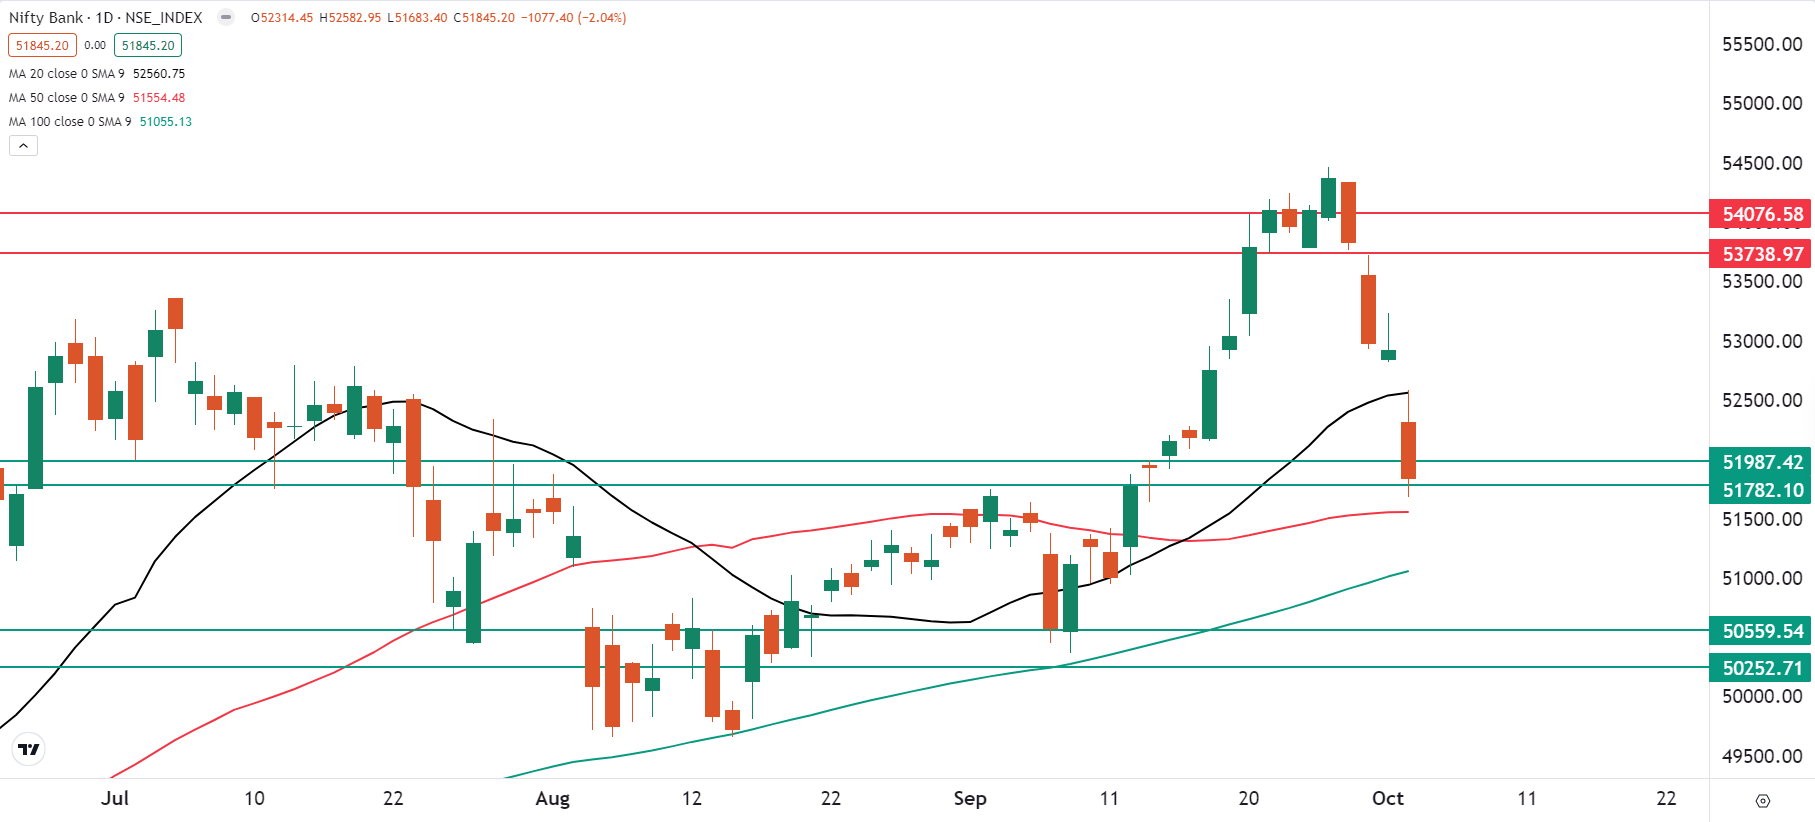
The BANK NIFTY Index extended its losing streak for the fourth consecutive day and closed below its 20-day moving average on Thursday. A bearish candlestick has formed on the daily chart, signalling further downward pressure. The index now sits on edge above its 50-day moving average, marking a crucial point where it could either find support or continue to fall.
As you can see on the chart below, the next crucial suppot for the index is around its 50-day and 100-day moving average (DMA). If the index closes below these levels, then it may extend decline upto 49,000, close to its 200 DMA. Meanwhile, on the upside, the 20 DMA will act as immediate resistance for the index.
 On the weekly chart, the BANK NIFTY is showing early signs of confirming a bearish shooting star candlestick pattern that formed last week. This pattern typically signals a potential trend reversal. If the index closes below the 51,900 level, it could indicate further weakness and an extended downtrend in the coming sessions.
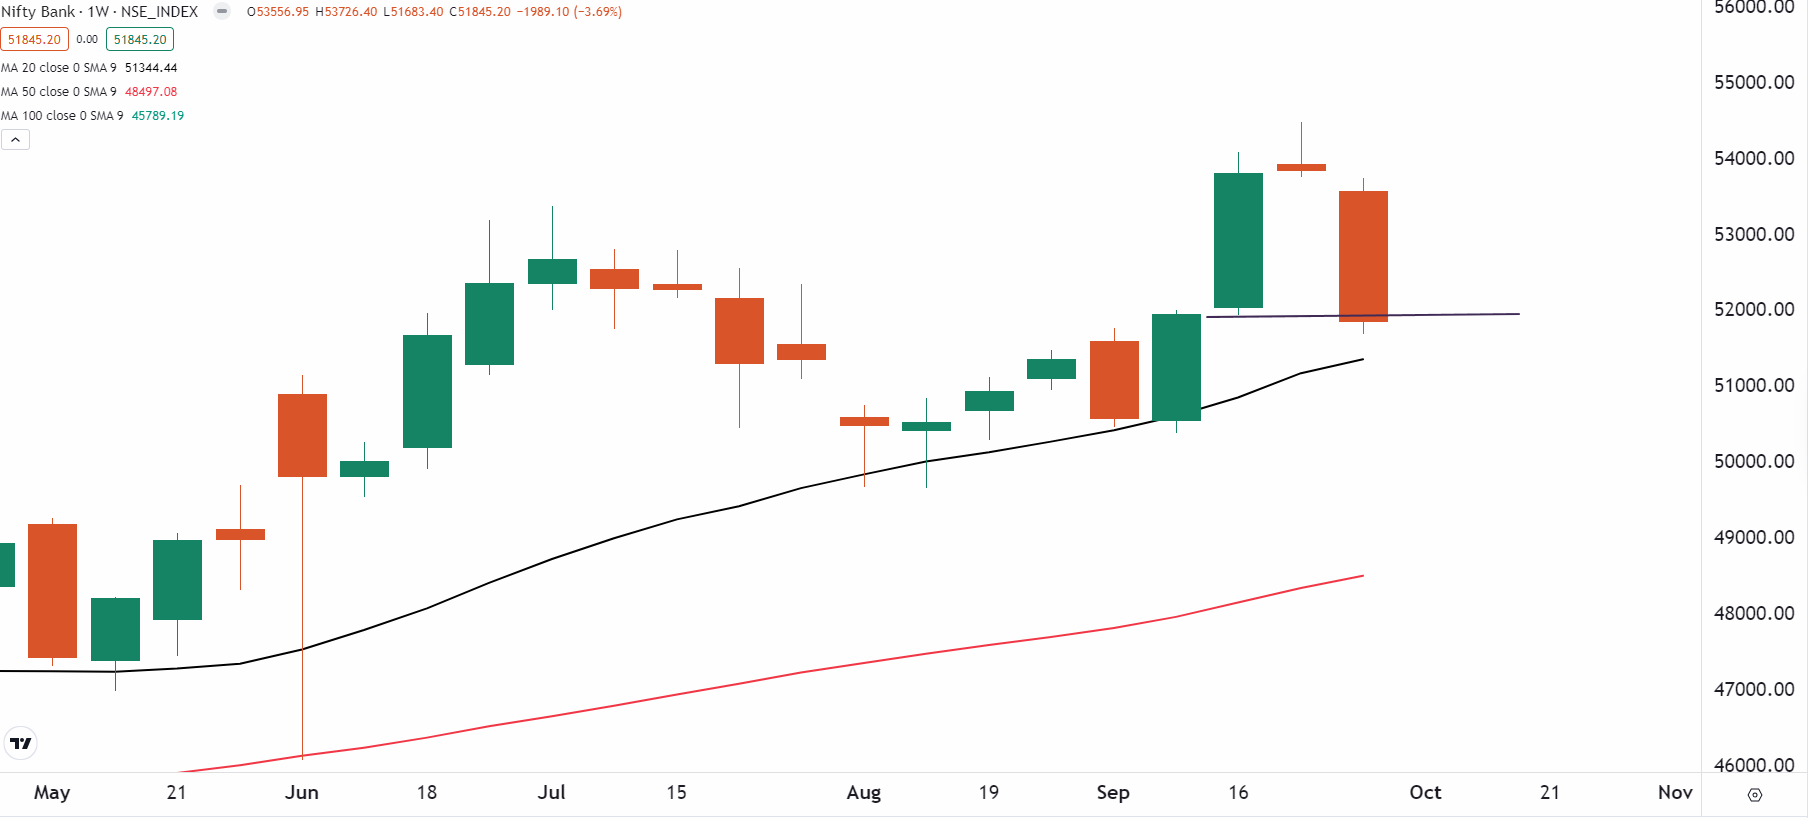
FII-DII activity
Stock scanner
Long build-up: Granules India
Short build-up: Dabur, Reliance Industries, GMR Airports Infrastructure, Power Finance Corporation and Godrej Properties
Under F&O ban: Bandhan Bank, Birlasoft, Granules India, Hindustan Copper, Manappuram Finance and RBL Bank
Out of F&O ban: NIL
Added under F&O ban: Granules India and Manappuram Finance
In Futures and Options or F&O, long build-up means an increase in Open Interest (OI) along with an increase in price, and short build-up means an increase in Open Interest(OI) along with a decrease in price.
Source: Upstox and NSE.
Disclaimer: Derivatives trading must be done only by traders who fully understand the risks associated with them and strictly apply risk mechanisms like stop-losses. The information is only for consumption by the client and such material should not be redistributed. We do not recommend any particular stock, securities and strategies for trading. The securities quoted are exemplary and are not recommendatory. The stock names mentioned in this article are purely for showing how to do analysis. Take your own decision before investing.
About The Author
Next Story


