Market News
Trade setup for Feb 4: NIFTY50 protects 21 EMA, but 23,500 looms as key resistance
.png)
4 min read | Updated on February 04, 2025, 08:00 IST


SUMMARY
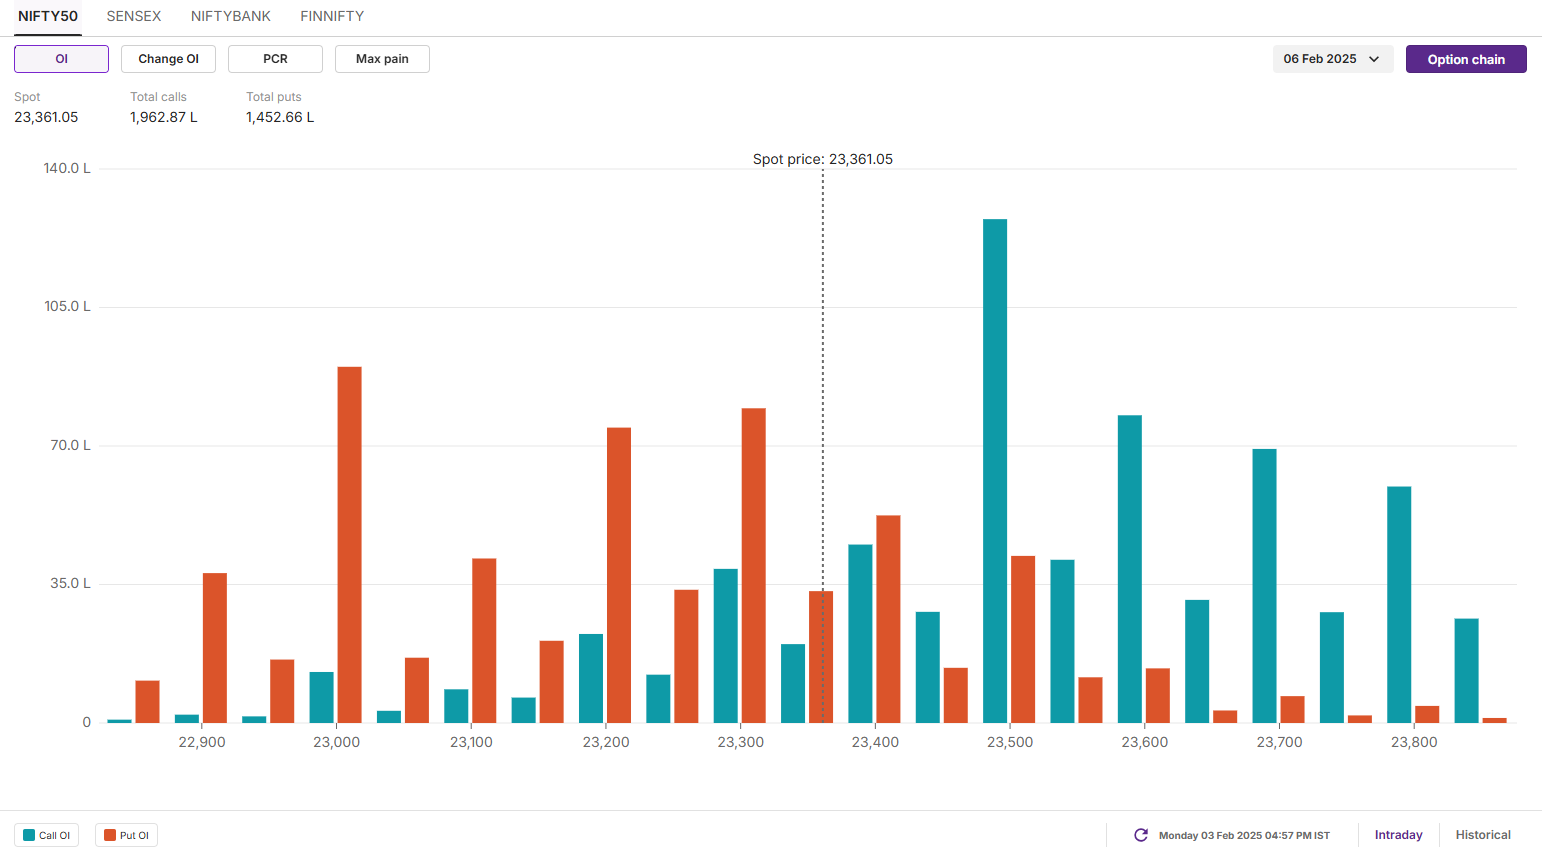
The NIFTY50’s February 6th expiry options chain reveals significant call open interest accumulation at the 23,500 strike, pointing to potential resistance in the 23,500-23,600 range.

NIFTY50 protects 21-EMA, but 23,500 looms as key resistance.|image source: shutterstock
Asian markets
GIFT NIFTY:23,536 (+0.51%) Nikkei 225: 39,175 (+1.63) Hang Seng: 20642 (+2.0%)
U.S. market update
Dow Jones: 44,421 (▼0.2%) S&P 500: 5,994 (▼0.7%) Nasdaq Composite: 19,391 (▼1.2%)
U.S. indices closed lower but recovered from the session’s low after President Trump said on Monday that he would pause new tariffs on Mexico for a month, although tariffs on China and Canada will still go into effect on Tuesday.
The Consumer discretionary stocks, which include carmakers, were hit on fears over the impact of the tariffs. Technology sector also lagged as shares of AI chip giant Nvidia, Apple and electric car maker Tesla all fell more in the range of 2.5% to 5%.
NIFTY50
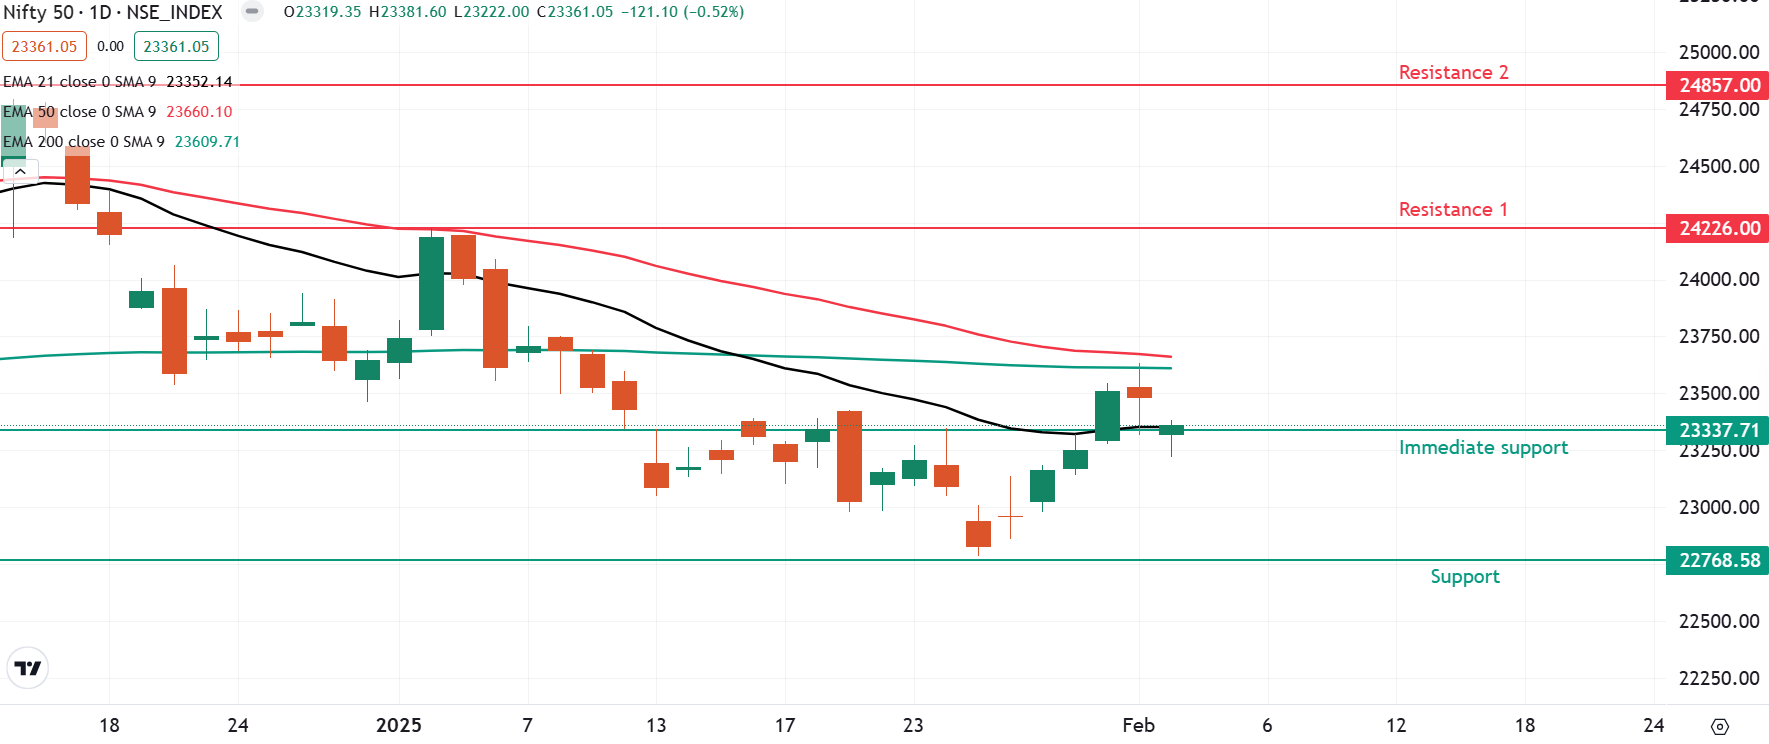
February Futures: 23,422 (▼0.4%) Open interest: 2,28,341 (▼1.5%)
Amid weak global cues, the NIFTY50 index started the February 3 session on a negative note and slipped below the crucial support zone of 21-day exponential moving average (EMA). However, the index rebounded from the day’s low and protected the 23,300 support zone on closing basis, indicating support based buying.
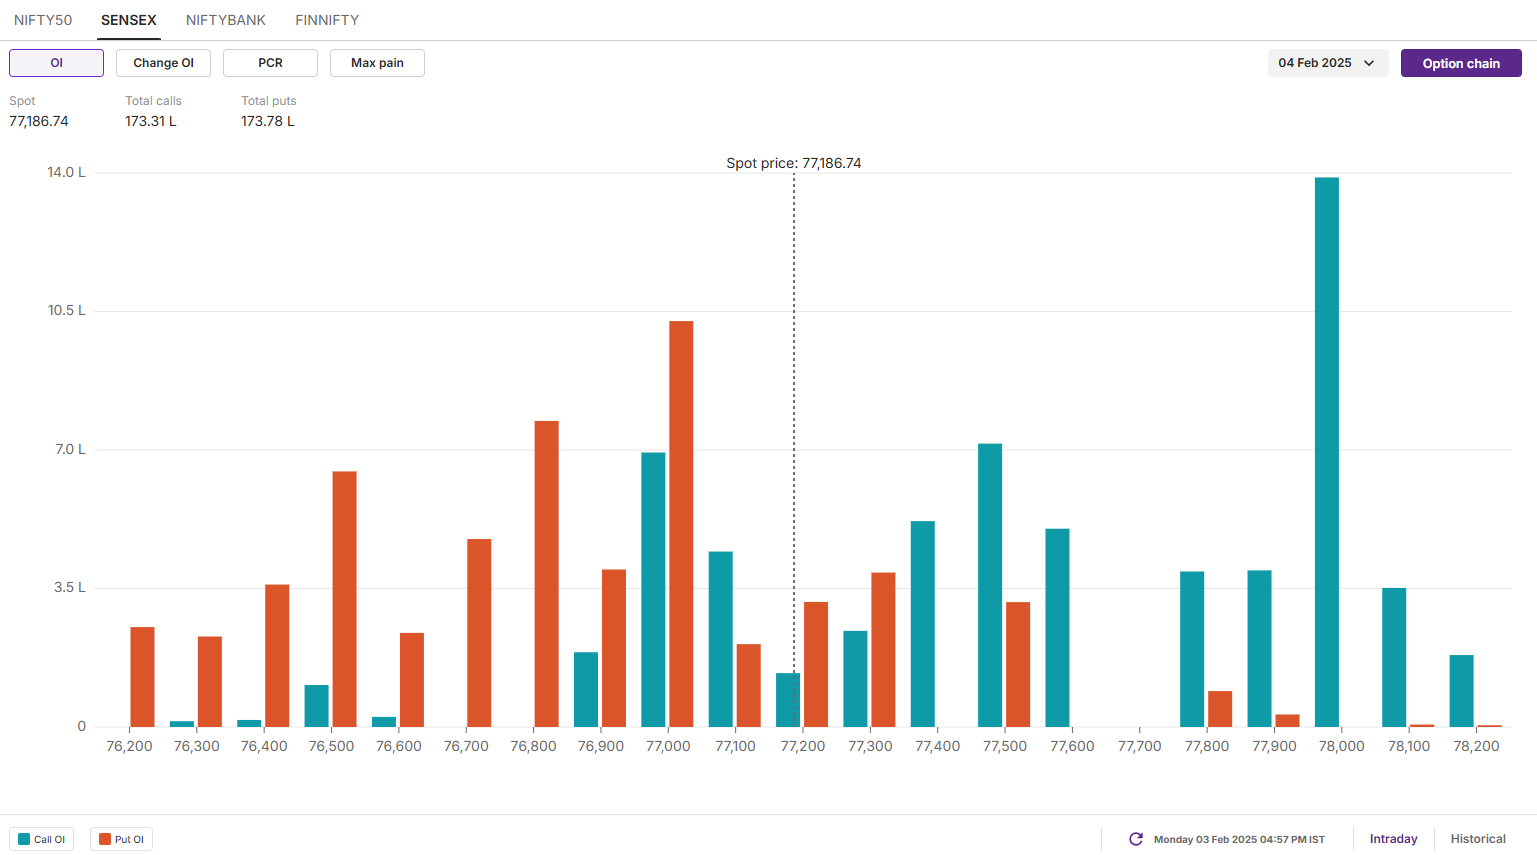
SENSEX:
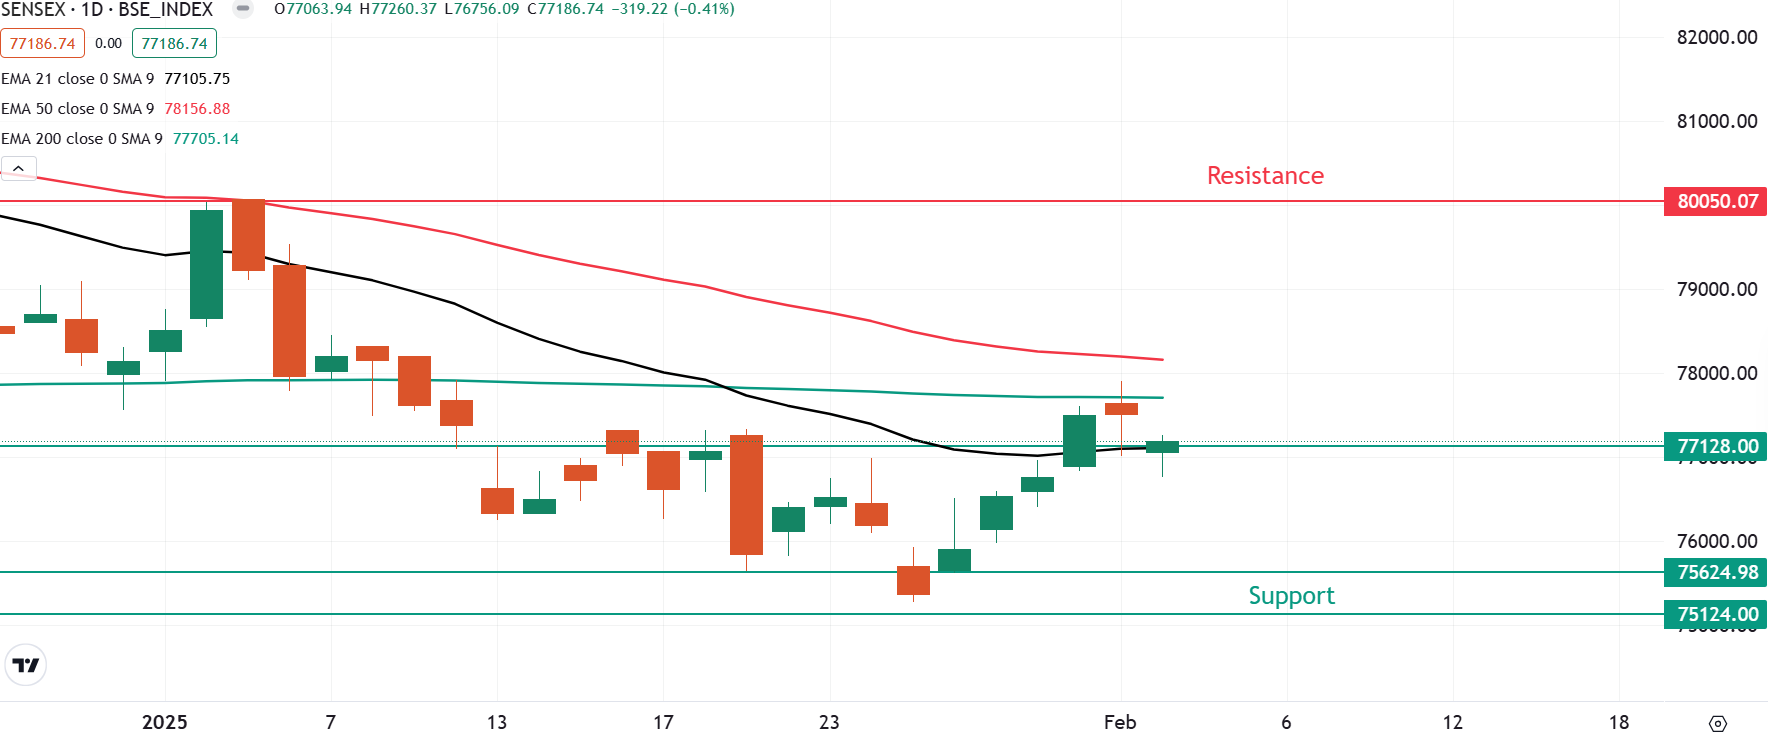
Max call OI: 78,000 Max put OI: 76,000 (20 Strikes from ATM, Expiry: 4 Feb)
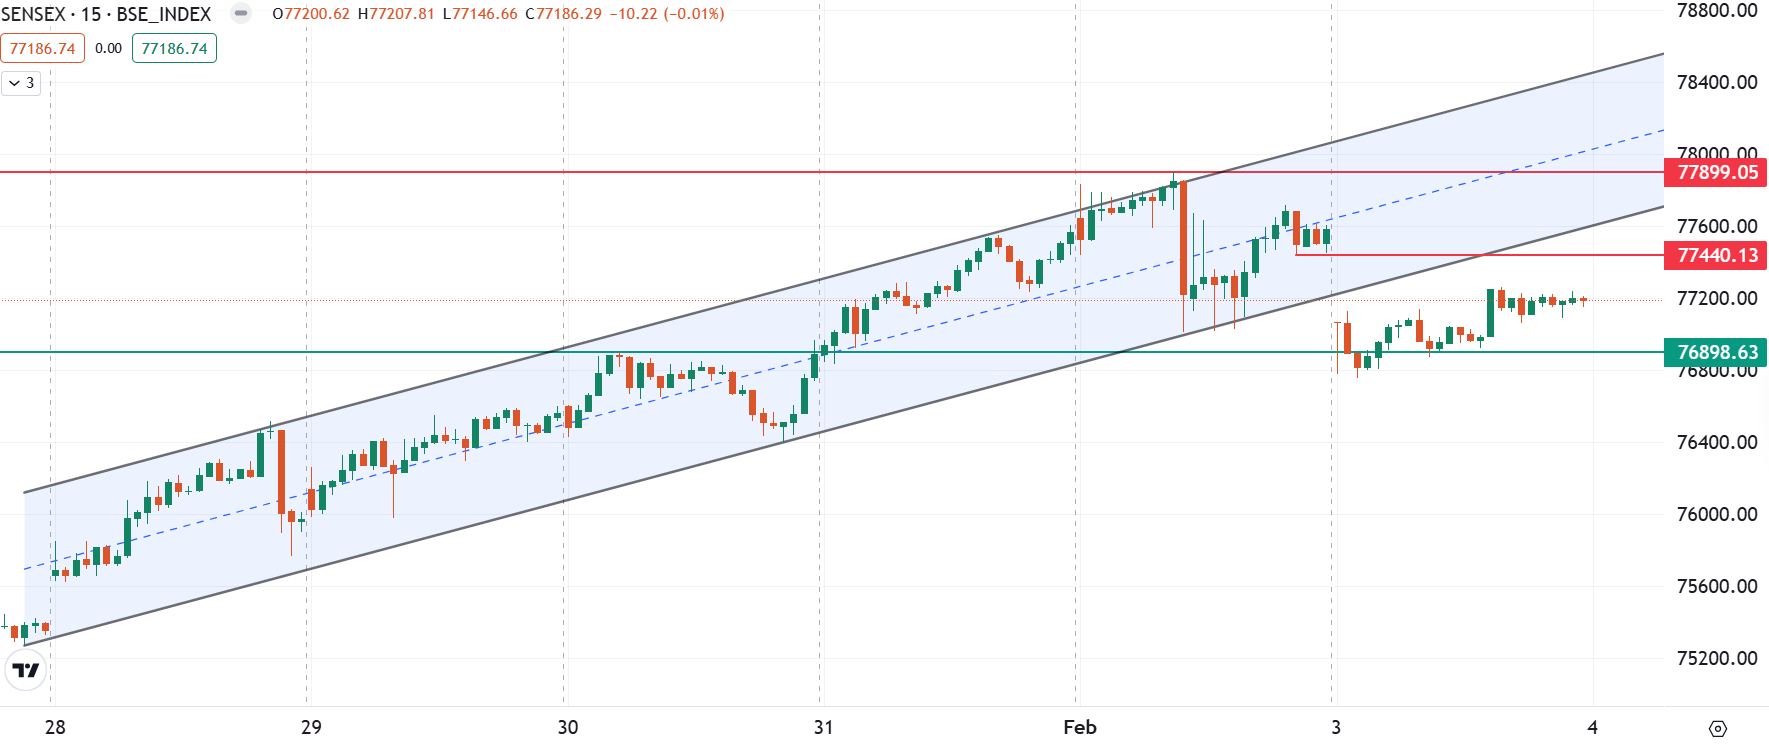
Meanwhile, the price action of the SENSEX on the 15 minute chart turned range-bound after opening below the rising channel pattern discussed in our 3 February’s trade setup blog. As highlighted on the chart below, traders can monitor the price action of the index around 78,000 and 76,800 zone. A break of this zone during intraday will provide short-term clues.
The open interest activity of the index for 4 February’s expiry saw significant call build-up at 78,000 strike, marking this as the immediate resistance zone for the index. Conversely, the put base was seen at 77,000 with low volume, indicating immediate support for the index around this zone.
In Futures and Options or F&O, long build-up means an increase in Open Interest (OI) along with an increase in price, and short build-up means an increase in Open Interest(OI) along with a decrease in price. Source: Upstox and NSE.
Disclaimer: Derivatives trading must be done only by traders who fully understand the risks associated with them and strictly apply risk mechanisms like stop-losses. The information is only for consumption by the client and such material should not be redistributed. We do not recommend any particular stock, securities and strategies for trading. The securities quoted are exemplary and are not recommendatory. The stock names mentioned in this article are purely for showing how to do analysis. Take your own decision before investing.
About The Author
Next Story


