Market News
Paytm Q3 results: Here's all you need to know about Q3 earnings preview, options strategy ahead of the results
.png)
4 min read | Updated on January 20, 2025, 07:53 IST
SUMMARY
Paytm is set to release Q3FY25 earnings today and it expected to report a net loss as compared to net profit in the previous quarter, which was aided by proceeds from sale of ticketing business to Zomato.
Stock list

Paytm reported a net profit of ₹295 crore during the last quarter.
As per expert estimates, Paytm’s Q3 revenue could see a 30-35% year-on-year (YoY) decline, ranging between ₹1,700 crore and ₹1,950 crore. However, revenue is projected to grow by 9-11% sequentially, compared to ₹1,660 crore in Q2FY25.
The company is likely to narrow its net loss to ₹32-₹38 crore, a notable improvement from the ₹222 crore net loss reported in Q3FY24. In Q2FY25, Paytm posted a ₹930 crore net profit, primarily driven by the ₹2,048 crore sale of its entertainment ticketing business, Paytm Insider, to Zomato.
Paytm is also pursuing the sale of its stake in Japan’s digital payments company, PayPay Corporation. Any progress on this deal could significantly boost the company’s profitability in the coming quarters.
Investors will pay close attention to the management’s commentary during the earnings announcement. Key areas of focus include the company’s growth trajectory following regulatory challenges, updates on loan disbursements, and the latest gross merchandise value (GMV) figures.
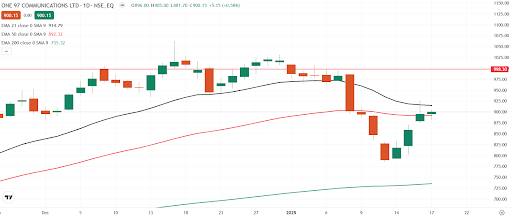
Ahead of the Q3 results, Paytm shares ended the week at ₹895 per share on Friday, January 17. However, the stock has declined 8.5% so far this month.
Technical View
The technical structure of the Paytm as per weekly and daily chart looks bearish. It confirmed the bearish piercing pattern formed for the week ending 3 January, indicating weakness.
A Bearish Piercing Pattern is a two-candle reversal pattern that signals a potential downtrend. It occurs when a bullish candle is followed by a bearish candle that closes below the midpoint of the previous bullish candle, indicating selling pressure. The pattern gets confirmed if the close of the subsequent candle is below the low of the reversal pattern.
Meanwhile, as per the daily chart, Paytm is currently trading between its 21-day and 50-day exponential moving averages (EMAs). Short-term traders can monitor the narrow trading range as a break above or below these levels on closing basis will provide further directional clues.

Options build-up
The open interest data of Paytm’s 30 January expiry saw highest build-up of both call and put options at 900 strike. This indicates that market participants are expecting range-bound activity around this strike. Additionally, significant put additions were also seen at 900 strike.
As per options data and at-the-money (ATM) strike of 900, the options market is expecting an implied movement of ±8% considering the combined premium of ₹71 ahead of its earnings announcement.
Options strategy for Paytm
For those looking to capitalise on the expected volatility, the Long Straddle strategy is appropriate. This involves buying both an at-the-money (ATM) call and put option with the same strike price and expiry of Paytm, with the aim of profiting from a move of more than ±8% in either direction.
Conversely, the Short Straddle strategy is suitable for scenarios where volatility is expected to fall. In this approach, a trader would sell both an ATM call and put option with the same strike price and expiry, implying that the price of Nestle India will remain within a range of ±8% after the earnings release.
For a deeper dive into Straddles, explore our UpLearn educational content for comprehensive insights. Interested in historical earnings price data? Join our community and connect with us—we’d be delighted to share it with you!
About The Author
Next Story

