Market News
Expiry day trade setup: NIFTY50 snaps ten-day losing streak, reclaims 22,300 resistance
.png)
3 min read | Updated on March 06, 2025, 07:16 IST


SUMMARY
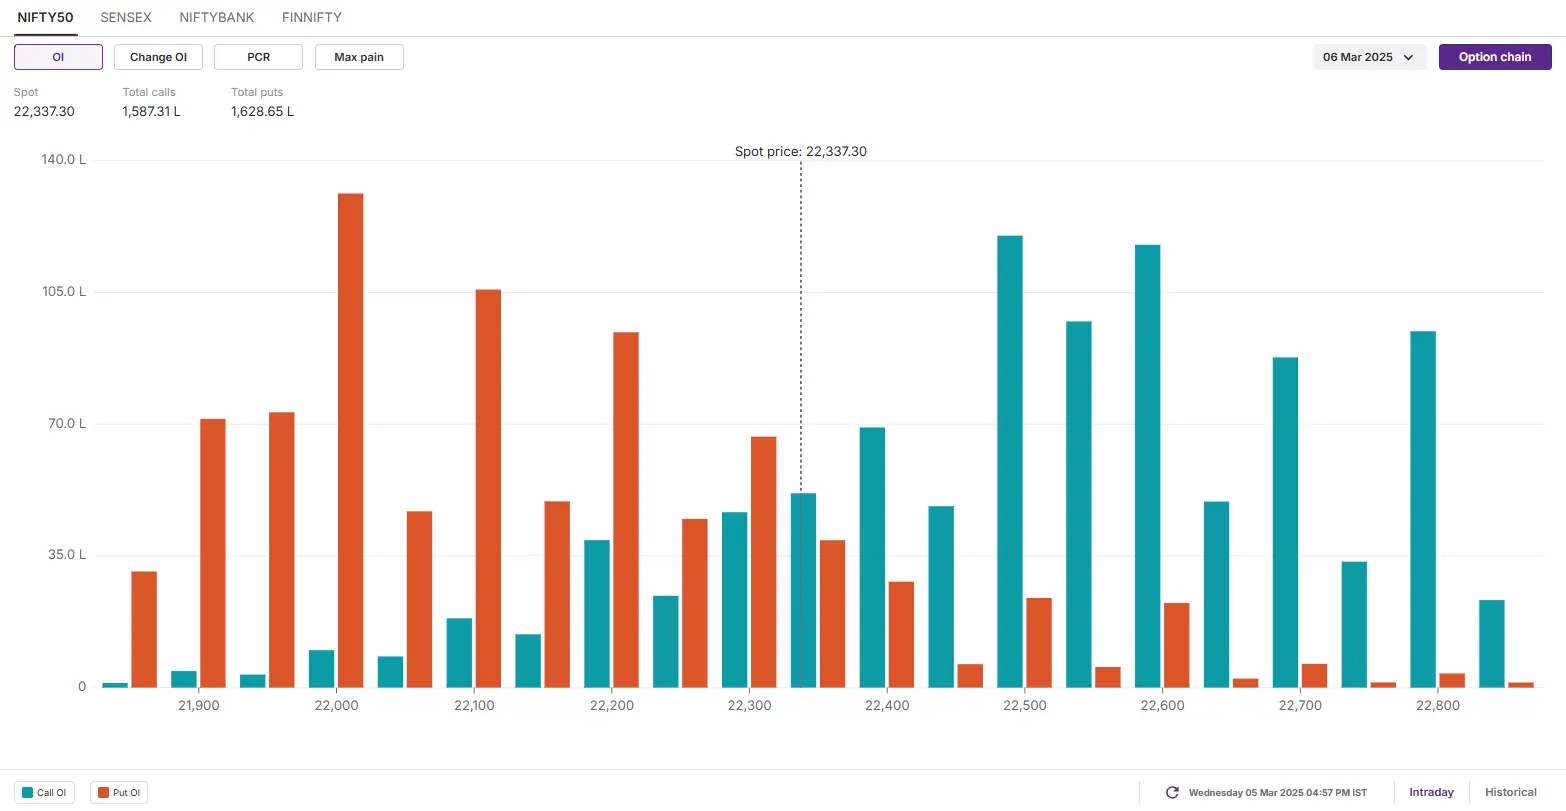
The options data for the March 6 expiry showed a significant put base at the 22,000 strike, suggesting strong support for the index around this level. Conversely, a notable call base emerged at the 22,500 and 22,600 strikes, indicating potential resistance in that range.

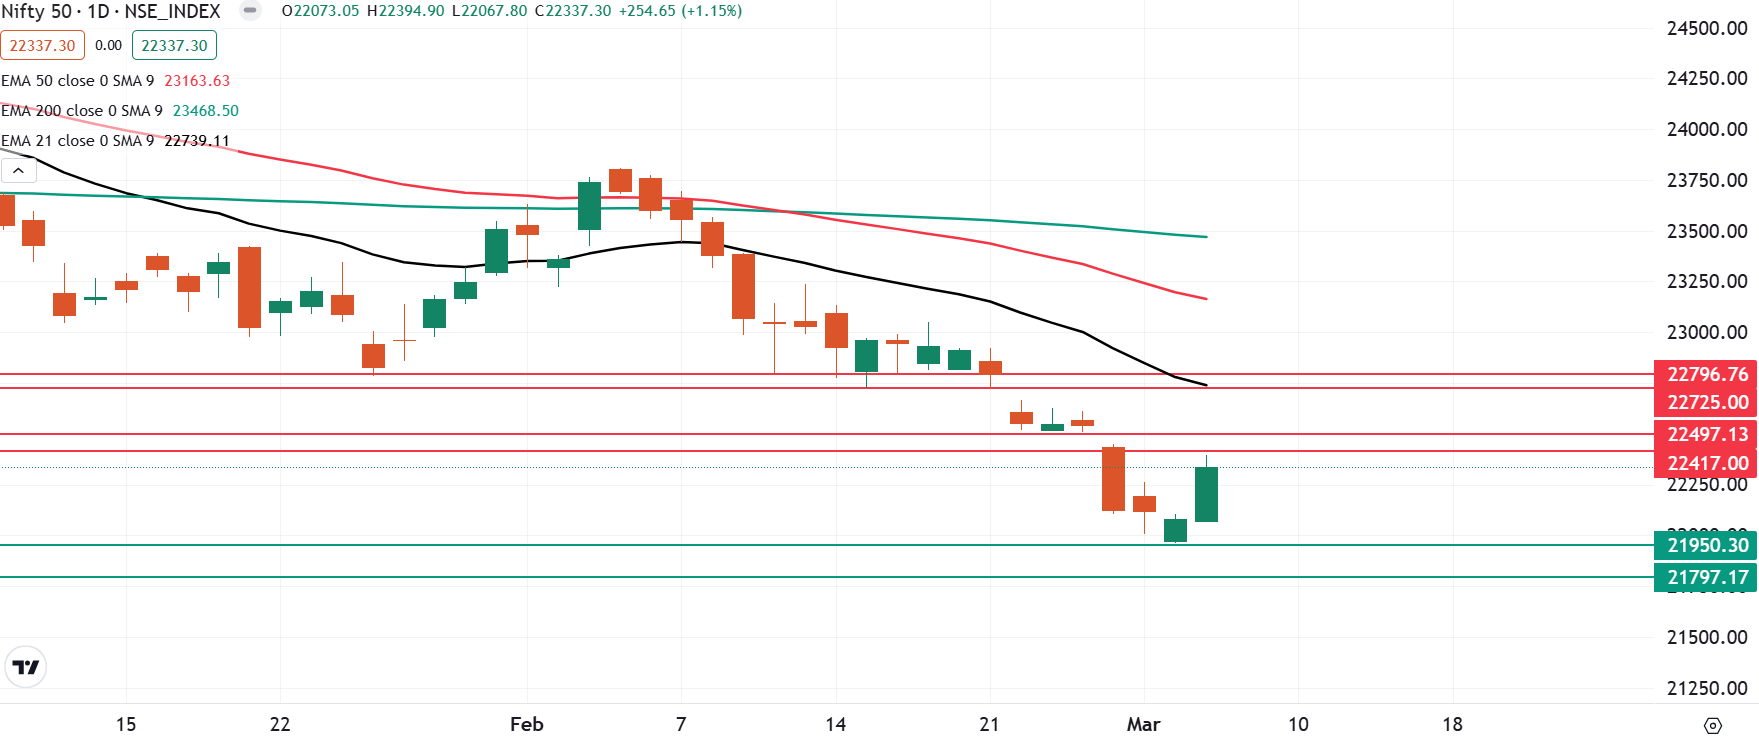
The NIFTY50 index formed a bullish candle on the daily chart, ending above previous session’s high after nineteen trading sessions.
NIFTY50
- Max call OI: 22,600
- Max put OI: 22,000
- PCR: 0.8
- (10 strikes from ATM)
The NIFTY50 index made a sharp recovery on March 5 and snapped its ten day losing streak. The index formed a bullish candle on the daily chart, ending above previous session’s high after nineteen trading sessions.
On the daily chart, the index closed above the high of the doji candlestick pattern formed on 3 March, indicating a positive rebound for the short-term. Unless the index closes below the low of the doji candlestick pattern, itcan extend the rebound towards its 21-day exponential moving average (22,739).
Intraday range
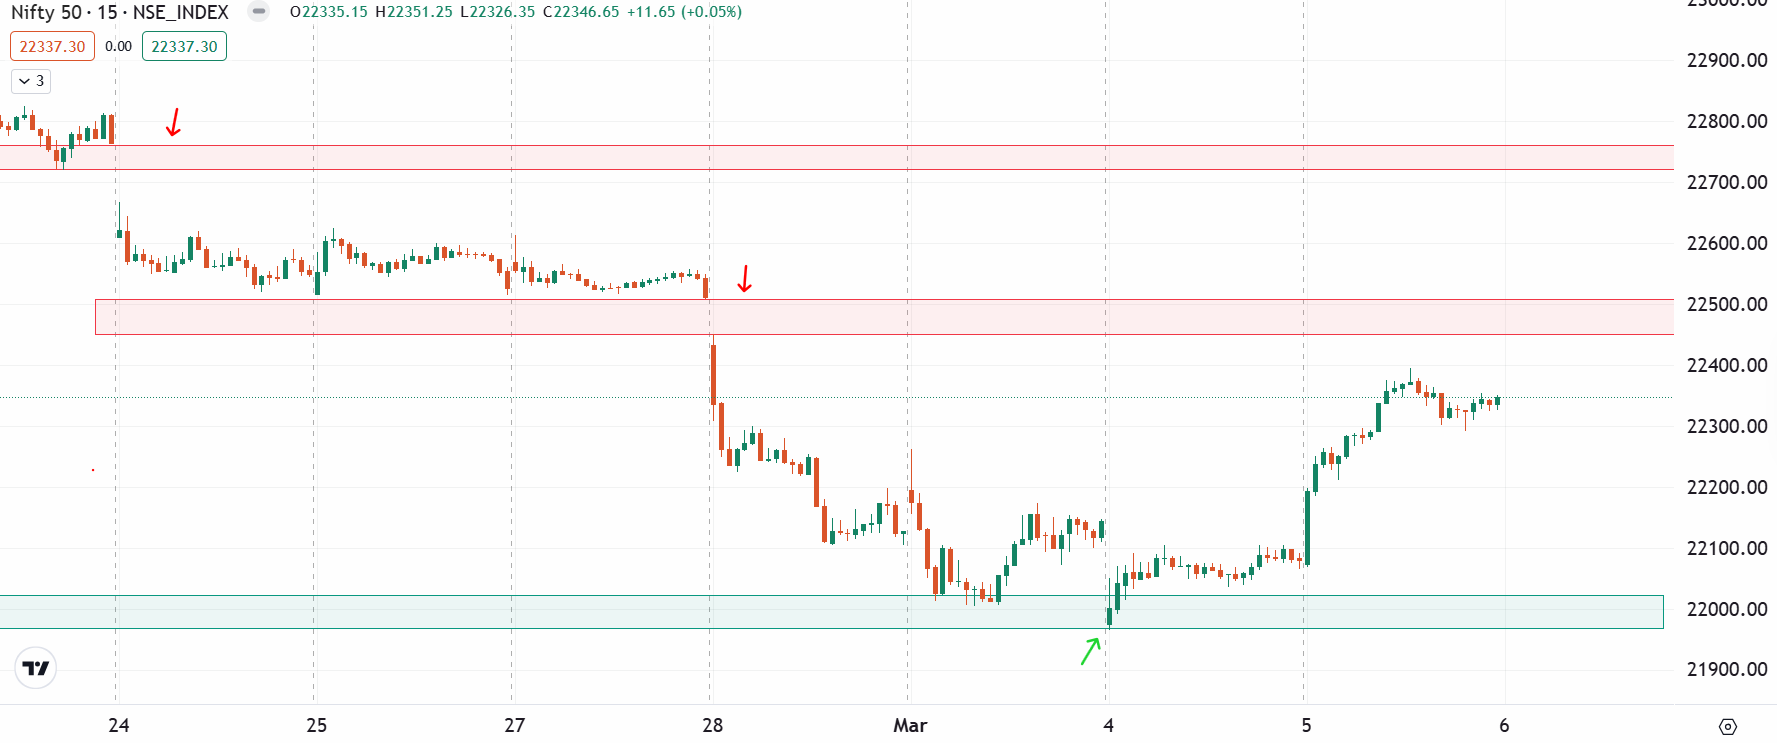
On the 15-minute chart, the index rebounded above the immediate support zone of 22,250 and is currently trading around ist resistance zone of 22,500. A close above this zone can push the index higher to the next resistance zone of 22,700. Meanwhile, a break below the 22,250 zone will push the prices around the 22,000 zone.
Options build-up
The open interest (OI) data for the 6 March expiry saw put base at 22,000 strike, suggesting support for the index around this zone. Conversely, the call base of the index was seen at 22,500 and 22,600 strikes, indicating resistance for the index around these levels.
Bullish outlook
Traders anticipating a break above the immediate resistance zone of 22,500 on the 15-minute chart, followed by a close, can consider a long call strategy.
On Wednesday, NIFTY50 closed at 22,337, making the ATM (at-the-money) strike 22,350. Buying an ATM call option sets the breakeven point at 22,426, which is 0.4% above Tuesday's closing price. This means the strategy will become profitable if NIFTY50 rises by more than 0.4%.
Bearish outlook
If you expect NIFTY50 to break the immediate support zone of 22,250, you can consider a long put strategy to capitalise on the bearish outlook. Buying an ATM put option with a 22,350 strike price would set the breakeven point at 22,267. This means the strategy will turn profitable if the NIFTY50 index declines by 0.3%.
Conclusion
Simply put, a long call strategy benefits from rising prices, while a long put profits from falling prices. Options provide the flexibility to adapt to various market conditions—whether bullish, bearish, or range-bound. However, past performance doesn’t guarantee future results. Before using any strategy, it’s crucial to evaluate the risks and have a solid plan for managing potential losses.
Disclaimer Derivatives trading must be done only by traders who fully understand the risks associated with them and strictly apply risk mechanisms like stop-losses. The information is only for educational purposes. We do not recommend any particular stock, securities and strategies for trading. The stock names mentioned in this article are purely for showing how to do analysis. Take your own decision before investing.
About The Author
Next Story


