Market News
Commodity trade setup for November 27: Gold, silver recover after bearish engulfing pattern; Crude stays range-bound
.png)
3 min read | Updated on November 27, 2024, 19:00 IST
SUMMARY
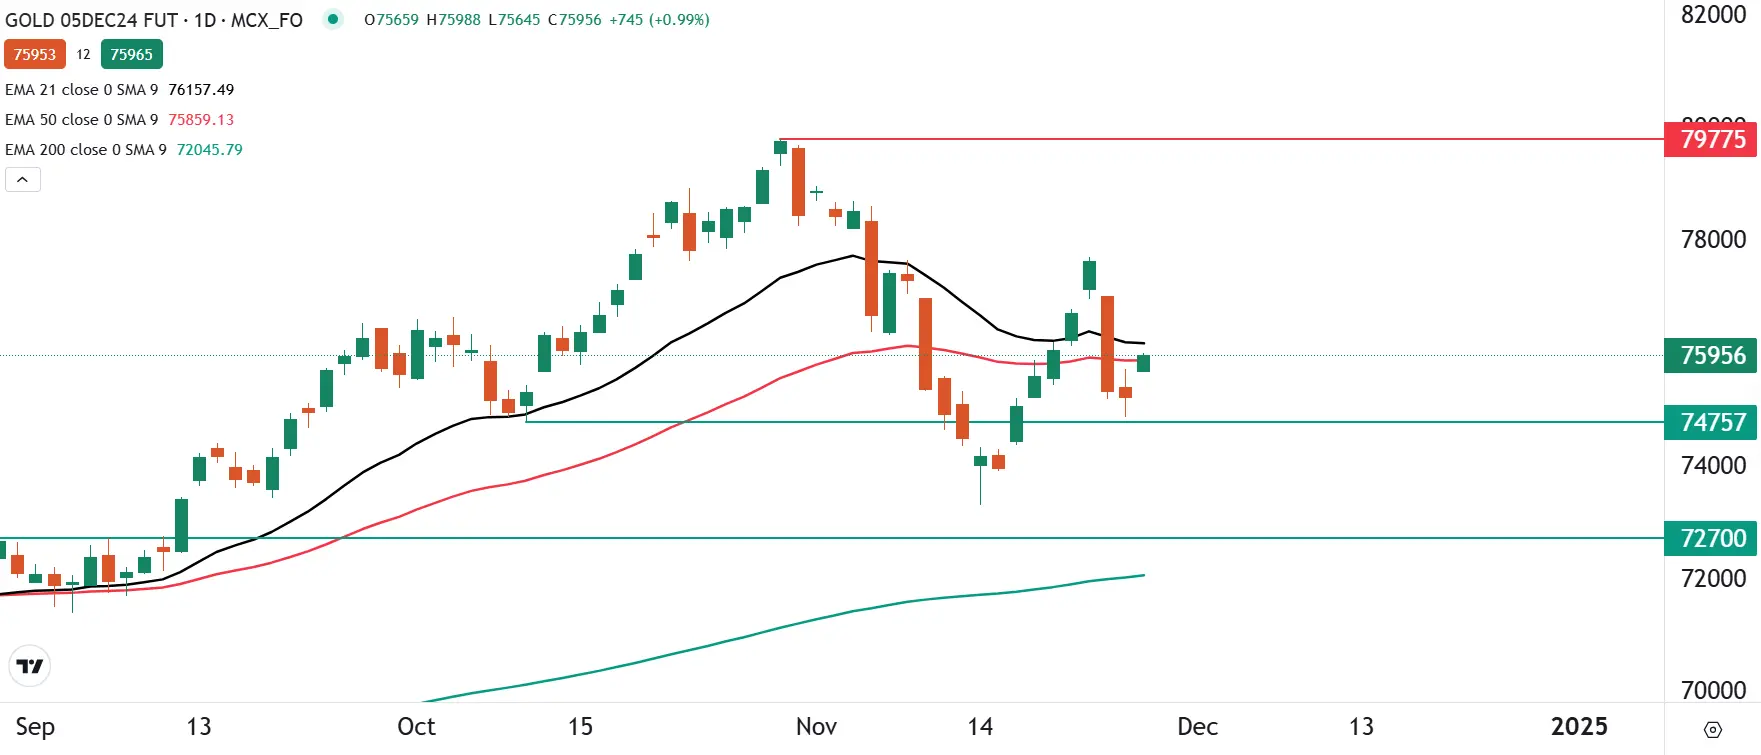
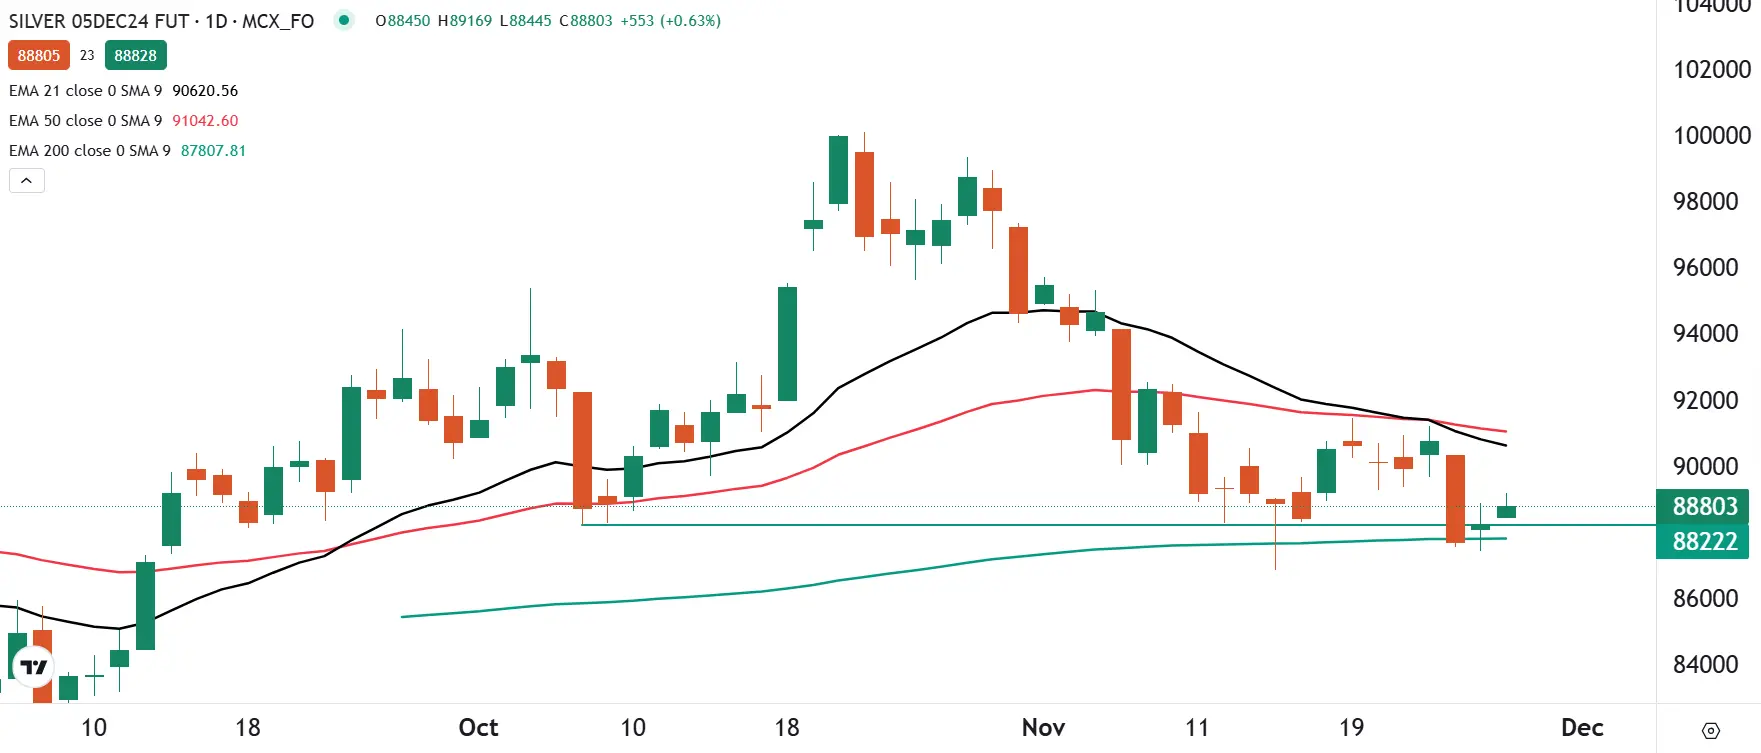
Both gold and silver formed bearish engulfing candles on the daily chart on the 25th, a classic bearish reversal pattern. In addition, on a closing basis, they breached their immediate support levels at their 21-day and 50-day EMAs, signalling further weakness in the near term.

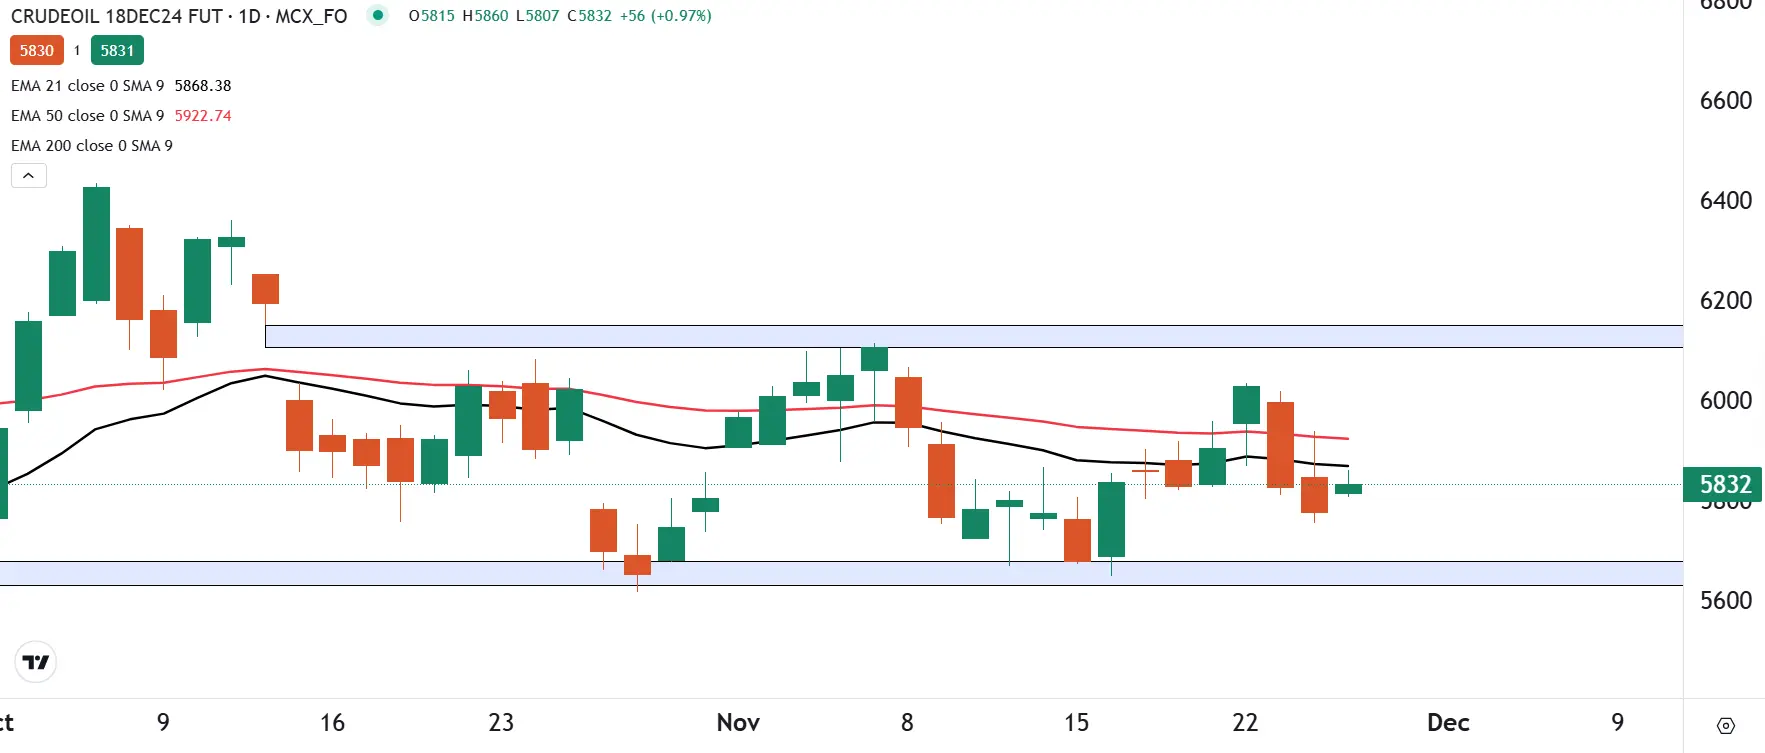
Oil prices are steady as investors remain cautious after the ceasefire deal between Israel and Hezbollah.
Market recap (as of 5:30 pm)
- Gold 5 Dec Futures: ₹75,972/ 10 gram (▲ 1.0%)
- Silver 5 Dec Futures: ₹88,575/ 1 kg (▲ 0.3%)
- Crude Oil 18 Dec Futures: ₹5,845/ 100 BBL (▲ 1.1%)
Meanwhile, markets also look forward to the Organization of the Petroleum Exporting Countries (OPEC+) meeting on December 1. According to reports, the OPEC+ group could delay the oil output increase set for January 2025 amid weak global demand and rising oil output outside the OPEC+ nation.
Technical structure


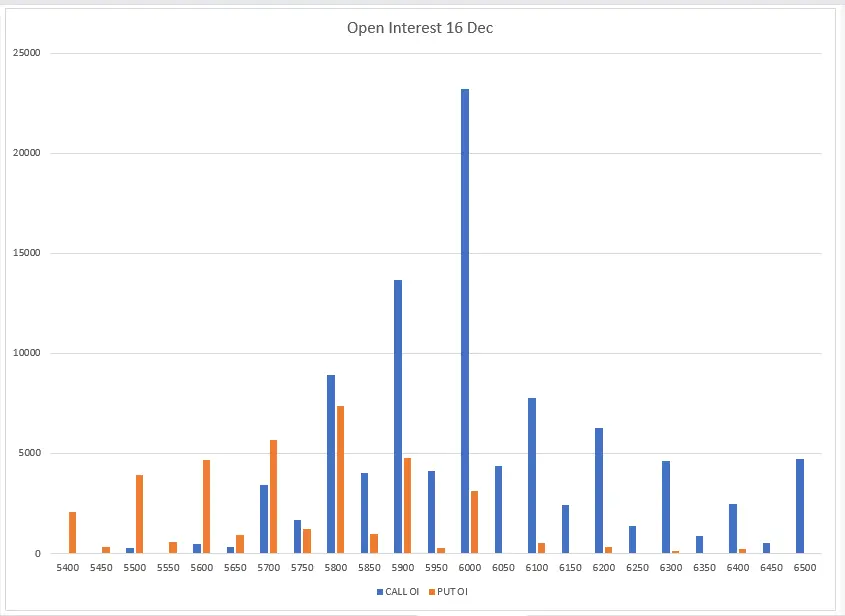
The open interest data for crude oil's 16 December expiry indicates the highest call base at the 6,000 and 5,900 strike prices, suggesting potential resistance around these levels. Conversely, the put base is concentrated at the 5,800 and 5,700 strikes, though with relatively lower volumes.

Disclaimer:
Derivatives trading must be done only by traders who fully understand the risks associated with them and strictly apply risk mechanisms like stop-losses. The information is only for the client's consumption, and such material should not be redistributed. We do not recommend any particular stock, securities, or strategies for trading. The securities quoted are exemplary and are not recommendatory. The stock names mentioned in this article are purely to show how to do analysis. Take your own decision before investing.
About The Author
Next Story

