How To Use Fibonacci Retracement For Support And Resistance
Written by Bidita Sen
Published on July 03, 2026 | 16 min read


Key Takeaways
- Fibonacci levels show where a moving stock price might pause or bounce.
- The tool acts like a map, highlighting key support and resistance zones.
- The 61.8% level is the most famous zone for price reversals.
- Always combine Fibonacci with other simple tools to confirm your trading decisions.
Novice traders find the topic of Fibonacci retracement more confusing and analytical than useful. But with experience the confusion turns into intrigue and complex mathematics gives way to a widely used tool for identifying key price levels and zones where a security may pause, reverse, or continue moving within a trend. These levels are derived from the Fibonacci sequence.
Markets do not move in straight lines, they often breathe in waves. Traders often buy large-cap stocks like Reliance or Tata Motors during a minor dip, only to be alarmed when these stocks plunge deeper. But a seasoned investor, who has mastered the concept of Fibonacci retracement, can identify potential areas where these price swings may find support or resistance. This knowledge helps transform confusing price moves into clear, predictable support and resistance zones.
What Is Fibonacci Retracement?
Fibonacci retracement levels are visual charting tools used by traders to spot potential support and resistance zones during pullbacks. In simple terms, they help traders identify possible price floors and ceilings.
Stock prices often move up or down sharply, but they rarely continue in one direction forever. They usually take a temporary step backward before continuing their journey. In the form of horizontal markers on a chart, Fibonacci retracement lines show where these temporary step-backs may end. Traders can spot key price areas where securities might pause, reverse, or continue trending.
Let’s delve deep into the concept and explain everything you need to know about Fibonacci retracement.
Origin Of Fibonacci Numbers
One cannot grasp the concept of Fibonacci retracements and their applications unless they understand the Fibonacci series.
This trading tool has its history reportedly dating back to 200 BC, with traces of it also claimed to be found in Indian and Arabic mathematical scripts. However, the Fibonacci sequence became widely known in Western Europe through Leonardo Pisano Bogollo, a famous 13th-century Italian mathematician nicknamed Fibonacci.
He introduced the concept to Western Europe and brought the following sequence to Western mathematics:
0, 1, 1, 2, 3, 5, 8, 13, 21, 34, 55, 89, 144, 233, 377, 610….
His book, Liber Abaci, made the sequence popular and helped replace Roman numerals with the more efficient Hindu-Arabic number system.
To build this sequence, you simply add the last two numbers together to get the next one. For example,
5 + 8 = 13, then 8 + 13 = 21.
If you divide almost any number in this sequence by the previous number (like 34 divided by 21), the ratio approaches 1.618 as the numbers become larger.
For example, 89/55 = 1.618 144/89 = 1.618 233/144 = 1.618
Again, if you divide a number by the number two places to its right (like 21 divided by 55), you get approximately 0.382.
For example, 34/89 = 0.382 55/144 = 0.382
In science and art, these mathematical relationships are associated with the ‘Golden Ratio’ often represented by the Greek letter phi (φ).
Fibonacci numbers are also found in certain natural growth patterns. For example, the arrangement of seeds in sunflowers, the spirals of pinecones, and the petal counts of some flowers often exhibit Fibonacci relationships.
There is also a remarkable consistency when a number in the Fibonacci series is divided by its immediate succeeding number.
For example: 89/144 = 0.618 144/233 = 0.618 377/610 = 0.618
Again, 0.618, when expressed as a percentage, is 61.8%.
Fibonacci retracement levels measure how much a security’s price pulls back before continuing in its trend. The key levels commonly monitored by traders are 38.2%, 50%, and 61.8%, as these often coincide with areas of support, resistance, and other technical indicators such as moving averages.
What Fibonacci Retracement Levels Are
This tool, once applied to a stock chart on your trading platform, automatically draws horizontal lines at key percentage levels. These percentages represent how much of the original price move has been ‘undone’ or retraced.
Traders choose the swing high and swing low as reference points once the trend is identified. Commonly used Fibonacci retracement tools are those that automatically generate key levels, including 23.6%, 38.2%, 50%, 61.8%, and 78.6%.
23.6% Level: This stands for a very shallow pullback. It indicates that the trend may be strong and that buyers are entering relatively early. It is a pause that a runner takes, probably just for a second, to tie their shoe before sprinting again.
38.2% Level: This is an example of a shallow retracement, which may suggest relatively strong momentum. It is usually considered a standard, healthy pause in a steady trend.
50% Level: Though not a Fibonacci ratio in the truest sense of the term, the level is almost always included on charts as it represents a psychological midpoint where an asset has given back exactly half of its recent gains.
61.8% Level: This is the most closely watched Fibonacci level and is regarded as the ‘Golden Ratio’. It stands for a deep pullback. If the price falls to this level and stops, some traders interpret it as a potentially important support area.
78.6% Level: This is one of the deeper retracements, which may indicate potential trend reversals in volatile markets. Many traders view it as a critical test of the existing trend. If the price falls significantly below this level, it may indicate that the original trend is weakening or reversing.
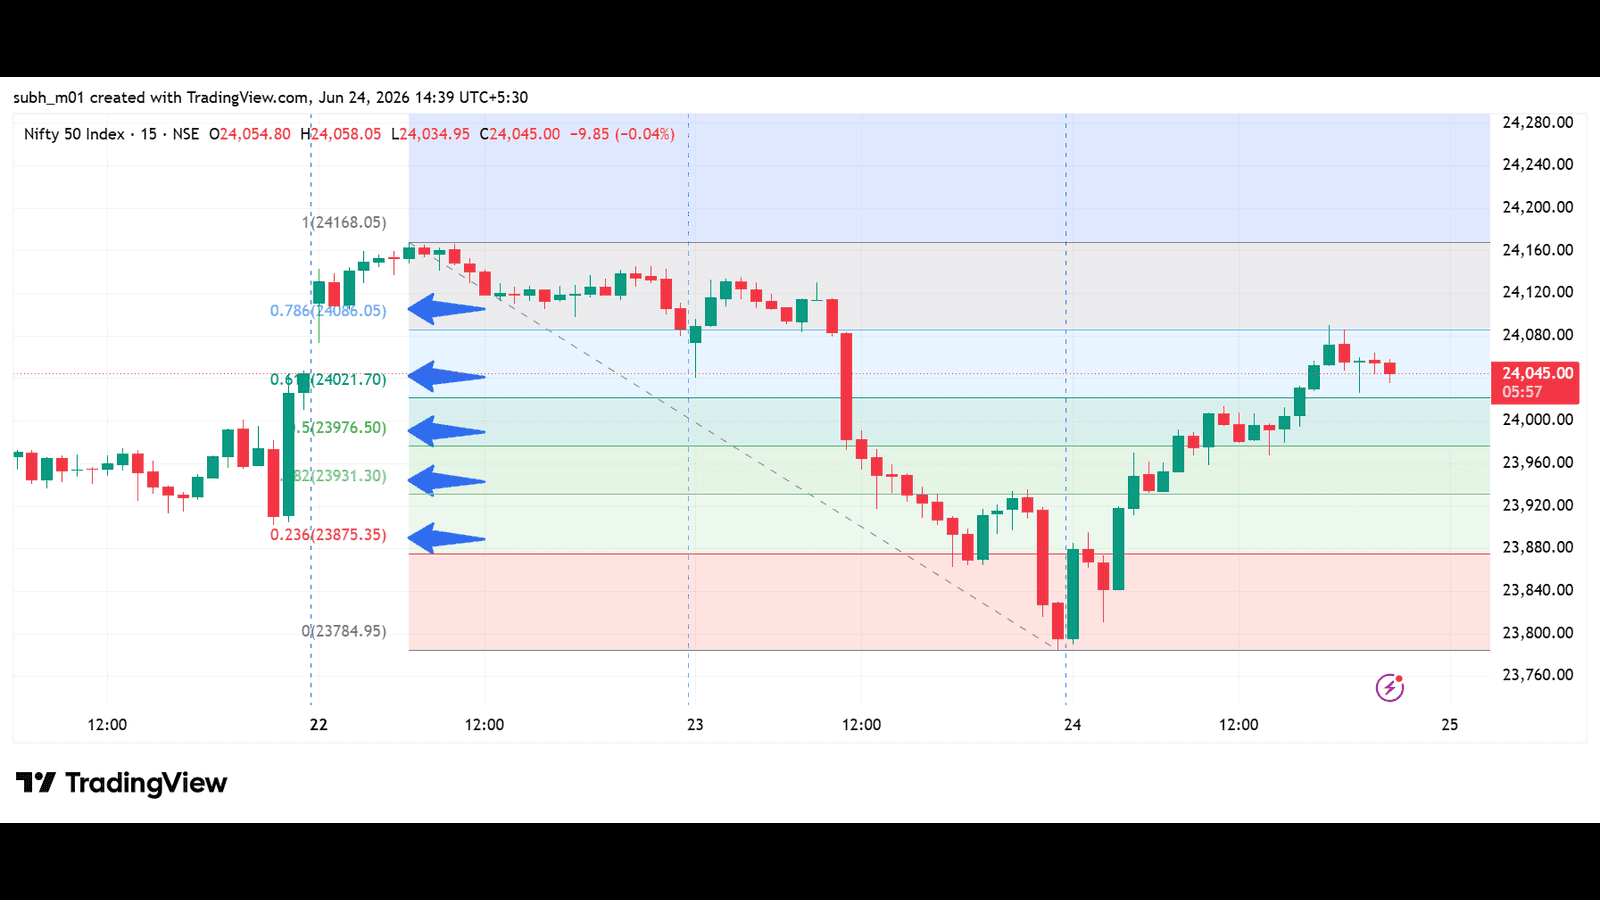
Source: Tradingview
Why Traders Use Fibonacci Retracement
Despite being based on a centuries-old mathematical sequence, Fibonacci retracement remains widely used in modern financial markets.
These levels are often monitored by traders, institutional investors, and trading algorithms when analysing potential support and resistance zones.
One explanation is that when many market participants monitor the same price levels, buying or selling activity may become concentrated around those areas, sometimes making the levels appear significant in practice.
| Retracement Level | Mathematical Origin | Trend Strength Signaled |
|---|---|---|
| 23.6% | Ratio of a number to the number three places to its right in the Fibonacci sequence | May indicate a relatively strong trend with a shallow pullback |
| 38.2% | Ratio of a number to the number two places to its right in the Fibonacci sequence | Often associated with a normal trend correction |
| 50.0% | Psychological halfway point | Balanced correction |
| 61.8% | The Golden Ratio | Widely monitored as a potential support or resistance zone |
| 78.6% | Square root of 0.618 | May indicate a deep pullback within an existing trend |
How Does Fibonacci Retracement Work?
Swing High and Swing Low In an uptrend, price pullbacks and bullish confirmation — such as candlestick patterns or Relative Strength Index (RSI) readings — are key areas that traders track to spot potential buying opportunities within the prevailing trend.
In a downtrend, a throwback (opposite of a pullback) toward a Fibonacci resistance level is often monitored by traders for signs that bearish momentum may resume.
To use the tool, you must locate a completed major price move on your chart. This requires identifying a Swing Low (the lowest point from which the move began) and a Swing High (the highest point reached before the pullback started).
Measuring Pullbacks Once these two points are chosen, the tool measures the vertical distance between them. It treats this total distance as 100%. As the price begins to retreat from its peak, the tool calculates the mathematical levels in between, showing you the extent of the pullback relative to the original move.
Traders often use stop-loss orders alongside Fibonacci levels as part of their risk-management framework. Some place stop-loss orders beyond nearby Fibonacci levels to allow for normal price fluctuations while limiting downside risk.
Identifying Potential Reversal Zones As the price drops toward these horizontal lines, they may act as potential support zones. Instead of guessing where a falling stock will stop, you can watch these pre-calculated lines to see whether buying interest emerges near those levels.
How Fibonacci Retracement Helps Identify Support Levels
In a healthy uptrend, a falling price is sometimes viewed by traders as an opportunity to accumulate shares at lower levels. Fibonacci retracement helps identify areas that may act as support.
As the price falls from its peak, it will encounter the Fibonacci lines. These lines are like floors in a building. When the price hits the 38.2% or 50% floor, buyers who missed the initial rally may become active. At the same time, short-sellers may buy back shares to close their positions. This increase in buying activity can slow or halt the decline, causing the area to act as support.
How Fibonacci Retracement Helps Identify Resistance Levels
In a bearish market, prices occasionally experience quick, temporary bounces upward. These are called relief rallies. Fibonacci retracement generally helps traders identify areas where these rallies may encounter resistance.
When the price bounces upward, the Fibonacci lines may act as ceilings. Traders who want to sell short may monitor the 38.2%, 50%, or 61.8% levels, expecting the broader downtrend to continue. When the rising price reaches these levels, selling activity may increase, potentially causing the price to resume its downward move.
Fibonacci extensions are used to spot potential profit-target levels. They are projected once the security resumes the overall trend, and the key extension levels include 100%, 161.8%, and 261.8%.
Most Important Fibonacci Retracement Levels For Support And Resistance
While all five levels are helpful, most traders focus on three specific lines.
| Level | Common Interpretation |
|---|---|
| 23.6% | Shallow retracement; usually occurs during strong, fast-moving trends. |
| 38.2% | Moderate retracement; often viewed as the first major area where buying interest may emerge. |
| 50.0% | Psychological level; represents a retracement of half the preceding move. |
| 61.8% | Golden ratio; widely monitored as a potentially important support or resistance zone. |
| 78.6% | Deep retracement; a break below this level may indicate that the existing trend is weakening. |
Fibonacci Retracement Example
Let us look at a simple, real-world example using an imaginary Indian stock called XYZ India Ltd. Let’s consider that XYZ India sees a massive rally, climbing from a Swing Low of ₹1,000 to a Swing High of ₹2,000.
The total range of this move is: Range = ₹2,000 - ₹1,000 = ₹1,000
Once the stock hits ₹2,000, investors start booking profits, and the price begins to drop. By dragging your Fibonacci tool from ₹1,000 to ₹2,000, the software calculates the key support levels:
Support at 38.2% = ₹2,000 - (₹1,000 × 0.382) = ₹1,618.00 Support at 50.0% = ₹2,000 - (₹1,000 × 0.500) = ₹1,500.00 Support at 61.8% = ₹2,000 - (₹1,000 × 0.618) = ₹1,382.00
As XYZ India falls, it passes ₹1,618.00, but when it reaches the ₹1,500.00 mark (the 50% midpoint), some traders may look for signs of support emerging near that level. If buying interest increases, the decline may slow, pause, or reverse.
How Traders Combine Fibonacci Retracement With Other Indicators
One common beginner oversight is to rely solely on a single Fibonacci line. Seasoned traders look for a confluence of multiple indicators pointing to the same price area.
Fibonacci Retracement and Support & Resistance
Many traders pay close attention when Fibonacci levels coincide with historical support or resistance zones.
If the 61.8% line overlaps with a price that was a major peak three months ago, some traders may view that area as a potentially significant support or resistance zone.
Fibonacci Retracement and Trendlines
You create a rising ramp by drawing a diagonal trendline along the bottoms of a rising chart. The point of intersection between this diagonal ramp and a horizontal Fibonacci line is widely seen as a potential support area where traders may watch for signs of a price reaction.
Fibonacci Retracement and Moving Averages
Moving averages generally smooth out price data to show the average price over a set period (like 50 days). If a stock pulls back to its 50-day moving average and that average overlaps with the 38.2% Fibonacci line, some traders consider this confluence a potentially important support area.
Fibonacci Retracement and RSI
The Relative Strength Index (RSI) is a momentum indicator that helps traders assess whether a stock may be experiencing relatively strong selling pressure (often referred to as oversold conditions) or relatively strong buying pressure (often referred to as overbought conditions).
If a stock falls to its 61.8% Fibonacci level and the RSI drops below 30, some traders interpret this combination as a sign that selling momentum may be weakening. However, it does not guarantee a price reversal, and traders typically seek additional confirmation before making decisions.
Advantages Of Using Fibonacci Retracement
Forward-Looking: Unlike many indicators that are based primarily on historical price data, Fibonacci retracement levels help traders identify potential areas of support and resistance before the price reaches them.
Easy to Use: Once you learn how to spot a major high and low, charting software does all the hard work for you.
Crowd Psychology: Because many traders monitor Fibonacci levels, these areas may attract increased buying or selling interest, which can make them relevant during price analysis.
Limitations of Fibonacci Retracement
Subjective: Choosing which high and low points to use is up to the individual. Two different traders might draw different lines on the exact same stock.
No Guarantees: The price will not always stop exactly on a line. Sometimes it will stop just short of it, or break through it completely during major market news events.
False Signals on Fast Charts: Many traders find Fibonacci retracement more useful on longer-term charts, such as daily or weekly charts. On shorter-term charts, such as 1-minute or 5-minute charts, price movements may contain more market noise, which can make interpretation more difficult.
Common Mistakes Traders Make When Using Fibonacci Retracement
Inconsistent Drawing: Many traders prefer to draw Fibonacci retracements consistently using the same reference points, whether that means measuring from candlestick wicks or candle bodies. Mixing different approaches may lead to inconsistent results.
Using Fibonacci Levels in Isolation: Some traders avoid relying solely on a Fibonacci level and instead look for additional confirmation signals, such as chart patterns, volume behaviour, or other technical indicators.
Ignoring the Big Picture: Fibonacci retracement levels are often analysed within the context of the broader market trend. Some traders consider trend direction, market structure, and other indicators before interpreting a potential support or resistance level.
Expecting Perfection: Think of Fibonacci levels as zones rather than precise price points. Prices may react near a Fibonacci level without touching it exactly, and small deviations are common in real-world market conditions.
Fibonacci Retracement vs Support And Resistance
While both tools help you find floors and ceilings, they work in different ways.
| Feature | Fibonacci Retracement | Traditional Support & Resistance |
|---|---|---|
| How It Is Calculated | Built from mathematical ratios of a prior price swing. | Derived from historical price behaviour, including previous highs, lows, consolidation zones, and other areas where prices have reacted in the past. |
| Adaptability | Can be adjusted when a new swing high or swing low is selected for analysis. | Typically based on historical price levels that traders continue to monitor over time. |
| New Highs / Lows | Can help identify potential support or resistance levels within a recent price move, even when no prior reaction exists at the exact level. | Primarily based on areas where the stock has previously traded and shown a price reaction. |
| Nature | Often viewed as potential zones of interest rather than precise price points. | Often viewed as areas where buying or selling interest may emerge. |

Wrapping Up
If you think Fibonacci retracement is a magic wand, you are mistaken. It is best viewed as a technical-analysis tool that many traders use to identify potential support and resistance areas within a price trend. It helps highlight price levels that market participants may monitor during a correction or pullback.
In doing so, it provides a structured framework for analysing price movements on stock charts. Seasoned analysts always treat Fibonacci levels as zones rather than precise price points. They are often used alongside other technical indicators and chart-analysis techniques to build a broader market view. Risk management remains an important aspect of trading and investing, as no technical indicator can guarantee a particular outcome.
FAQs
What is Fibonacci retracement in stock market trading?
Fibonacci retracement is a technical analysis tool that uses key percentage levels derived from the Fibonacci sequence to identify potential support and resistance areas during a price pullback. Traders use these levels to analyse where a trend may pause or resume.
What are the most important Fibonacci retracement levels?
The most commonly used Fibonacci retracement levels are 23.6%, 38.2%, 50%, 61.8%, and 78.6%. Among these, 38.2%, 50%, and 61.8% are typically the most closely watched by traders when analysing pullbacks.
How do you draw Fibonacci retracement levels on a chart?
To draw Fibonacci retracement levels, traders identify a significant swing low and swing high on a chart. The Fibonacci tool is then applied between these two points, automatically generating the key retracement levels.
Is Fibonacci retracement accurate?
Fibonacci retracement does not predict price movements with certainty. Instead, it highlights potential support and resistance zones that traders monitor. Many traders use it alongside other indicators, such as trendlines, moving averages, and the Relative Strength Index (RSI), for additional confirmation.
What is the difference between Fibonacci retracement and Fibonacci extension?
Fibonacci retracement is used to identify potential support and resistance levels during a pullback within an existing trend. Fibonacci extension is used to estimate potential price targets after the trend resumes.
Can Fibonacci retracement be used for intraday trading?
Yes, Fibonacci retracement can be applied to intraday charts as well as daily, weekly, and monthly charts. However, shorter timeframes may contain more market noise, so traders often combine Fibonacci levels with other technical-analysis tools before interpreting price movements.
Which Fibonacci retracement level is considered the most important?
The 61.8% level, often called the Golden Ratio, is one of the most widely monitored Fibonacci retracement levels. Many traders consider it a significant area of potential support or resistance, although it should not be used in isolation.
About Author
Bidita Sen
Senior Editor
Bidita Sen has spent over a decade first understanding the complex language of finance, then translating it into something humans can actually read. After a career spent chasing market trends, she now prefers chasing ghosts. When she's not working, you’ll find her reading or re-watching the Paranormal Activity series. Because, real-life math is much scarier than a haunted house.
Read more from Bidita


Upstox is a leading Indian financial services company that offers online trading and investment services in stocks, commodities, currencies, mutual funds, and more. Founded in 2009 and headquartered in Mumbai, Upstox is backed by prominent investors including Ratan Tata, Tiger Global, and Kalaari Capital. It operates under RKSV Securities and is registered with SEBI, NSE, BSE, and other regulatory bodies, ensuring secure and compliant trading experiences.
Related articles
Share Market
What is Trade-to-Trade (T2T) Stock Segment? All You Need to Know12 min read | Written by Subhasish Mandal
Share Market
What is Positional Trading? Meaning, Types, Strategies14 min read | Written by Subhasish Mandal
Share Market
How To Use Open Interest For Intraday Trading: Complete Guide14 min read | Written by Bidita Sen

Share Market
What Is Stop Loss In Trading? Meaning, Types, & How To Use It15 min read | Written by Bidita Sen
Share Market
What Is ICRA? Why Its Credit Ratings Matter To Investors9 min read | Written by Bidita Sen
Share Market
What Is Demerger: Meaning, Process, Examples & Impact14 min read | Written by Bidita Sen