Let’s say, you received an email from your HR department asking you to list the objectives you have achieved this year as part of your appraisal process.
Exciting, right? But how do you summarise information that spans over 365 days? Unless you are an Aryabhatta, you will have to go through key milestones and achievements to analyse the past year quickly.
Achieving important targets, delivering massive growth on a project and leading a team to success would perhaps summarise the achievements. On the other hand, poor performance in some tasks and lack of initiatives to grow the business would fall into the 'areas to work on' category.
With this evaluation, you can assess your performance and the key highs and lows of your professional year. Indexes play a similar role in markets. Let’s tell you how.
What is an index?
Since thousands of stocks are listed on our exchanges, it is virtually impossible to analyse and track each company individually. So, the exchanges like NSE and BSE arrange a group of shares based on criteria like trading frequency, share size, etc., to make an index. It helps to track a certain segment or the market as a whole.
In simple terms, these indices are created by selecting listed companies that meet a predefined criteria. These indices can be based on variables such as industry, segment or market capitalisation. So, if the shares of the top listed companies are doing well, you'd say that the index of that particular group of companies has outperformed this year and vice versa.
Different types of indices
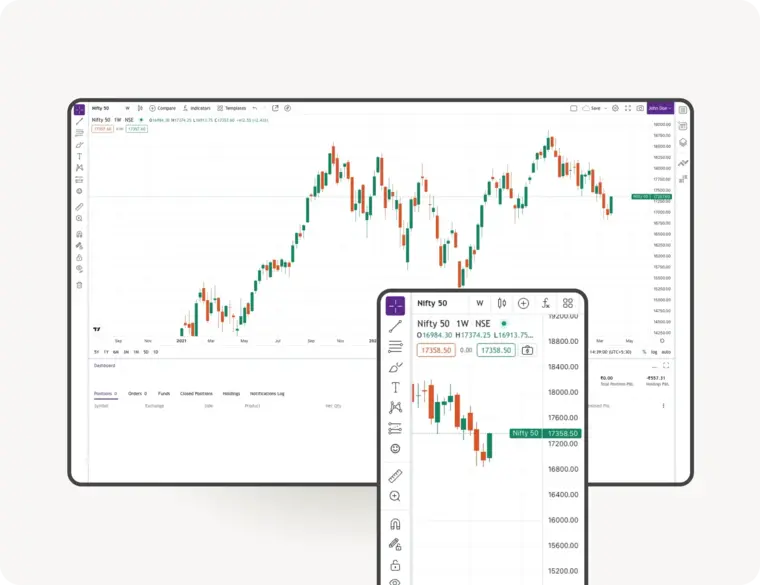
- Broad market indices: In India, seventeen broad market indices are on the NSE. Overall, the NSE owns and manages 350 indices under the NIFTY brand, including the NIFTY 50. The NIFTY 50, which comprises the top 50 companies in India, is also called the benchmark index. Likewise, India's oldest equity index, the SENSEX, comprises the 30 best-performing companies managed by the Bombay Stock Exchange (BSE).
- Sectoral indices: While SENSEX and NIFTY 50 provide the overall picture and trend of the economy, sectoral indices summarise the specific sectors or industries. These sectoral indices are constructed in a similar manner as the broad market indices. Usually, when you buy or sell a stock in a particular sector, you first analyse the trend of the sectoral index for that sector.
For example, under the NIFTY brand, we have 15 sectoral indices viz. Automobiles, Banking, Private Bank, PSU Bank, Realty, IT, Financial Services, FMCG, Pharma, Metal, Oil & Gas, Healthcare, Consumer Durables Media and Financial Services 25/50.
- Thematic indices: Thematic indices track the performance of companies that represent a movement in a particular theme. These include themes such as materials, consumer, energy, public sector, infrastructure, MNCs and services.
- Strategy indices: These are multi-factor indices that track the performance of a portfolio of equities based on factors such as quality, value, alpha and low volatility. As of 29th March 2023, there are 34 strategy indices under the NIFTY brand. Some of the strategy indices are:
-
- NIFTY Alpha 50: tracks the performance of 50 stocks with high Alphas in the last one year.
- NIFTY 100 Equal Weight: includes constituents of the Nifty 100 Index.
- NIFTY Low Volatility 30: tracks the performance of 30 stocks in Nifty 100 with the lowest volatility in the last year.
- Fixed income indices: The NIFTY fixed income indices are benchmark indices for the fixed income market in India. These indices cover the universe of government securities, treasury bills, corporate bonds of various credit ratings, commercial papers, certificates of deposits and overnight rates.
- Hybrid indices: The NIFTY hybrid indices measure the performance of hybrid portfolios comprising indices from NIFTY 50 and aggregate fixed income indices. Hybrid indices under the brand NIFTY measures govt, state and corporate bonds.
Conclusion
The indices provide a historical comparison of the returns on money invested in the stock market versus other forms of investment, such as gold or bonds. These returns can be used as a benchmark against which to compare the performance of an equity fund. These returns also act as a leading indicator of the performance of the economy as a whole or of a particular sector.