A Beginner's Guide to Option Chain Analysis in the Stock Market
Written by Subhasish Mandal
Published on April 16, 2026 | 8 min read


Option Chain Analysis
Option chain analysis is a technique that traders use to identify the important support and resistance levels of an underlying index or stock. It involves data interpretation of the call and put options, open interest (OI), change in OI, implied volatility and volume.
Key Takeaways
-
The option chain analysis helps to understand overall market sentiment by analysing open interest and various other components of the option chain.
-
While doing option chain analysis, high Call OI indicates resistance, and high Put OI indicates support.
-
A put-call ratio (PCR) above 1 signals fear in the market, and the price might fall, whereas a PCR below 0.70 is considered safe and stable, indicating bullishness in the market.
Introduction to Option Chain
An option chain is a widely used tool in options trading because it displays crucial call and put data in real-time. It helps traders and investors understand the market sentiment by showing how participants are positioned at different price levels.
In India, NSE (National Stock Exchange) publishes option chains of indices such as Nifty, Bank Nifty, Finnifty, and other tradable indices and stocks. Similarly, BSE (Bombay Stock Exchange) does the same for Sensex, Bankex, and selected stocks.
Understanding option chain data is one of the practical ways to understand what smart money might be doing in the market. In this guide, we’ll break down everything you need to know about option chains, from basics to advanced concepts, so you can confidently use them in trading.
What is an Option Chain?
An option chain is a structured table that displays all available option contracts for a particular index or a stock. It is divided into two sections: call options (CE) and put options (PE).
It provides detailed information about each option contract, present in all different expiry periods, including their strike prices, and other key statistics such as open interest (OI), implied volatility (IV), last traded price (LTP), volume, change in OI and put-call ratio (PCR).
Example of NSE Nifty Option Chain
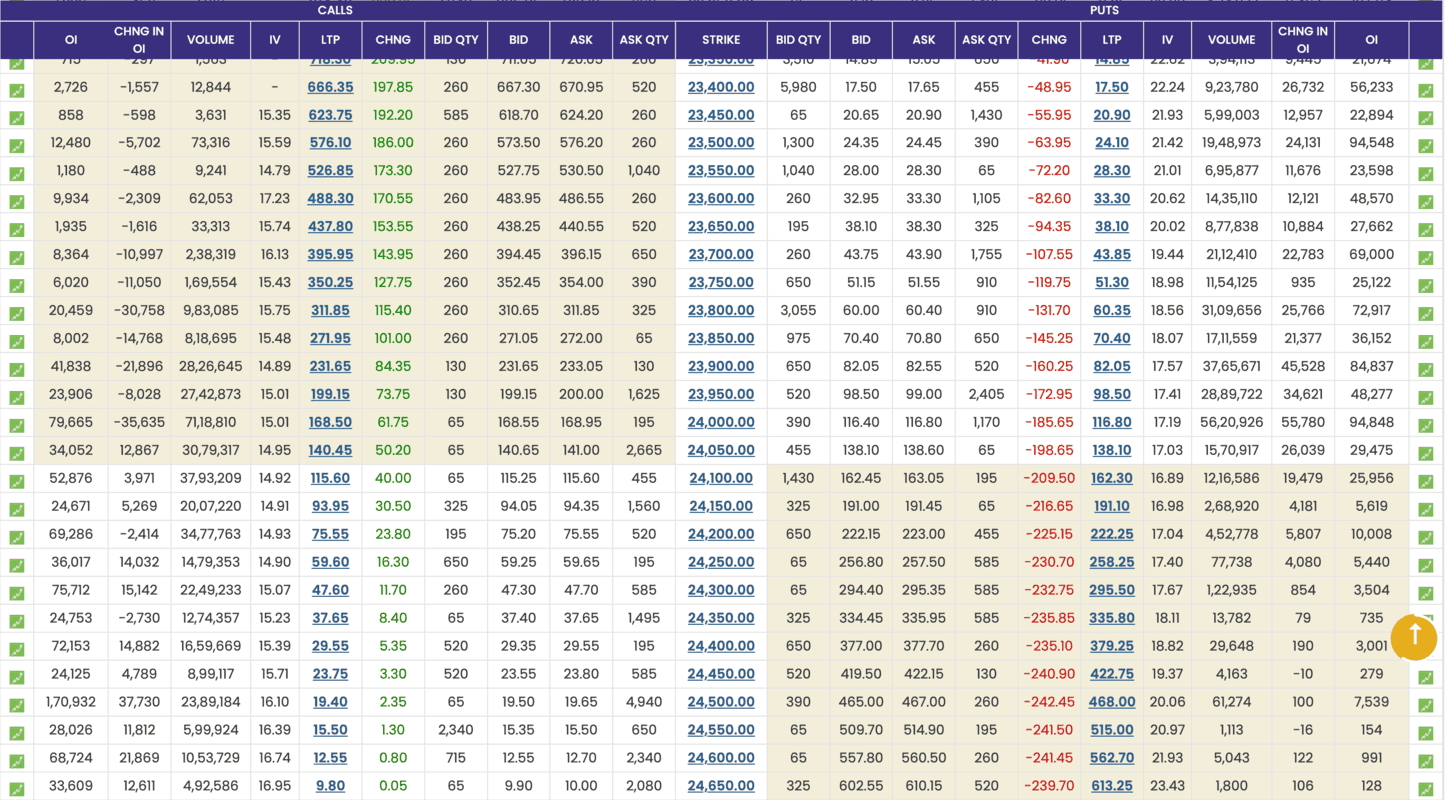
Source: NSE
What are Calls and Puts in the Option Chain?
The Call option and Put option are types of derivative contracts, based on which option trading is exercised.
1) Call Option (CE):
A call option gives you the right, but not the obligation, to buy an underlying asset at a predefined price (called strike price) before or on the expiration date.
2) Put Option (PE):
A put option gives you the right, but not the obligation, to sell an underlying asset at a predefined price before or on the expiration date.
Most people think that when you buy a call option, someone sells a put option. But that’s not true. This is the key concept in option trading that often confuses beginners.
The correct concept is:
When you buy a call option, someone must sell the same call option at an agreed price. Similarly, when you buy a put option, someone must sell the same put option at an agreed price.
Components of the Option Chain in NSE and BSE
The option chain provided by NSE and BSE includes data of Calls on the left and Puts on the right. The other key components are as follows:
1) Strike Price:
This is the agreed-upon price at which the option can be exercised. This price is set when the option contract is created and doesn’t change over time, regardless of how the underlying security prices fluctuate.
2) Premium:
This is the price that traders want to pay to buy or sell option contracts. Call and Put options both had premiums. The option buyer and seller transact based on the premium price. In the option chain, the premium is displayed as the last traded price (LTP).
3) Open Interest:
OI is the total outstanding contracts in an option chain. Every strike price had Call OI and Put OI, indicating how many traders were active at that strike price.
4) Change in Open Interest:
This section shows the percentage change in OI. If new contracts were added, then OI will increase, or else if old contracts are settled off, then OI will decrease. The OI change data is updated every three minutes when the market is open.
5) Volume:
This section shows the total number of contracts traded over a particular period of time.
6) Implied Volatility (IV):
It shows the expected volatility in the asset. IV indicates how much stock may move, but not in which direction. High IV suggests an expensive premium due to high volatility, whereas low IV suggests a cheaper premium due to low volatility.
How to Analyse Option Chain Data For Trading?
Before you know how to analyse an option chain, it is important to understand a key principle followed by most market participants. Option chains are analysed from a seller's perspective, not from a buyer's perspective.
The simple reason is that the seller's profit is limited, but the loss is unlimited. Whereas the option buyer’s profit is unlimited, the loss is limited.
Here is a practical approach to analyse NSE BSE option chain data for various contracts:
Step 1: Identify the At the Money (ATM) strike
Locate the strike price near the current market price of the underlying asset.
Step 2: Check Open Interest Levels
Look for the strike price with the highest OI in call options and the highest OI in put options. The strike which had the highest Call OI is considered a strong resistance level, whereas a strike with high Put OI is considered a strong support level.
Step 3: Analyse the change in Open Interest
If Call OI is positive near the ATM strikes, it indicates a bearish sentiment, and the price may fall or face resistance.
On the other hand, if Put OI is positive near the ATM strikes, it indicates bullish sentiment, and the price may increase or hold the support level.
Negative Call OI means unwinding of bearish positions, and Negative Put OI means unwinding of bullish positions.
- Bullish scenario = Addition to Put OI and unwinding of Call OI.
- Bearish scenario = Addition of Call OI and unwinding of Put OI.
Step 4: Analyse Volume
Check the volume of Call and Put. If any unusual volume spike is visible, it shows that smart money is preparing for a big move. Usually, such moves trigger in the direction of the trend.
Step 5: Evaluate Implied Volatility
If the IV is high, the option premium fluctuation can be wild; if the IV is low, the option premium is expected to remain stable.
Step 6: Combine With Price Action
Combine option chain analysis with the price action, technical analysis, support/resistance, and market news. Options are volatile; the market sentiment can change overnight. Therefore, it's good to include technical analysis with option chain analysis to get better results.
Significance of NSE Option Chain
The NSE option chain is an essential tool for traders who want to trade options contracts listed on the National Stock Exchange. It provides all the details regarding contracts, expiry dates, and options activity during market hours.
The NSE option chain displays call and put data for 50 to 60 strikes. This data is updated every 3 seconds in the live market. The “In the Money” strikes are highlighted in yellow, making it easier to identify the ITM, OTM, and ATM strikes.
By interpreting the option chain data from NSE, you can identify important support and resistance levels of any tradable index or stock.
The option chain provided by BSE is similar to the NSE. However, as of 2026, the traders primarily rely on NSE options data due to higher volume.
Uses of the Option Chain
Here are the uses of the option chain provided by NSE and BSE:
1) Market Sentiment Analysis:
By analysing open interest, change in OI, implied volatility, and PCR ratio, you can understand the market sentiment.
2) Forecasting Volatility:
Implied volatility in options is very useful for forecasting volatility. If the IV is high, markets are expected to remain volatile, and if the IV is low, the market might remain stable.
3) Liquidity Analysis:
The bid/ask spread and volume indicate the liquidity of the particular option contracts. Liquidity is important for entering and exiting the trade.
4) Trend Confirmation:
By observing the changes in open interest and volume, you can confirm the market trend and build a position accordingly.

Wrapping Up
Mastering option chain analysis can transform your trading journey in the stock market. Understanding key components such as open interest, change in OI, implied volatility, and volume helps you to get deeper insights into the market behaviour.
About Author
Subhasish Mandal
Sub-Editor
A finance professional with strong expertise in stock market and personal finance writing, he excels at breaking down complex financial concepts into simple, actionable insights. Holding a Master’s degree in Commerce, he combines academic depth with practical knowledge of technical analysis and derivatives.
Read more from Subhasish


Upstox is a leading Indian financial services company that offers online trading and investment services in stocks, commodities, currencies, mutual funds, and more. Founded in 2009 and headquartered in Mumbai, Upstox is backed by prominent investors including Ratan Tata, Tiger Global, and Kalaari Capital. It operates under RKSV Securities and is registered with SEBI, NSE, BSE, and other regulatory bodies, ensuring secure and compliant trading experiences.
Related articles


Futures and Options
What are Option Greeks? Delta, Gamma, Theta, Vega, and Rho Explained7 min read | Written by Subhasish Mandal