Stock alert | Understanding the Wedge Pattern

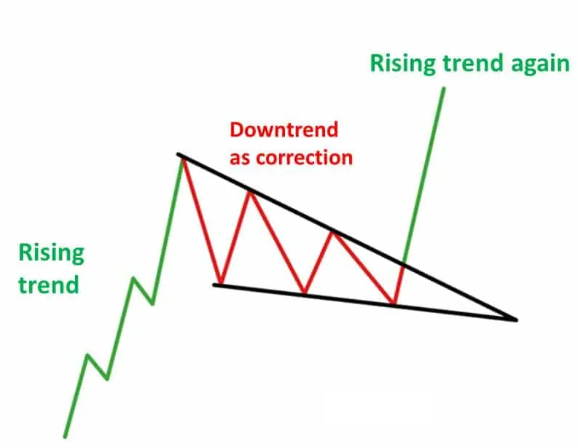
What is a Wedge Pattern?
A wedge pattern represents a period of consolidation before the price breaks out or breaks down. It takes the shape of two converging trend lines with the formation of lower highs and lower lows. As the space between two trendlines gets narrower, the likelihood of a strong breakout on either side increases. After the wedge formation, the chances of a breakout are higher in an ongoing uptrend. This is called a bullish wedge pattern.
Pattern Implications
The wedge pattern is a continuation or a reversal pattern. Once the stock breaks the upper trendline of the wedge pattern and the price closes above the upper trendline — it signals the continuation of the ongoing uptrend.
Trading Strategy
In such a scenario, the traders can deploy a bull call spread strategy. In this strategy, a trader can go long on an ATM (at-the-money) call option and initiate a short position in a far OTM (out-of-the-money) call option, both belonging to the same expiry. The short OTM call option acts as a hedge to the long ATM call option, thereby capping a trader’s profit or loss to a certain level.
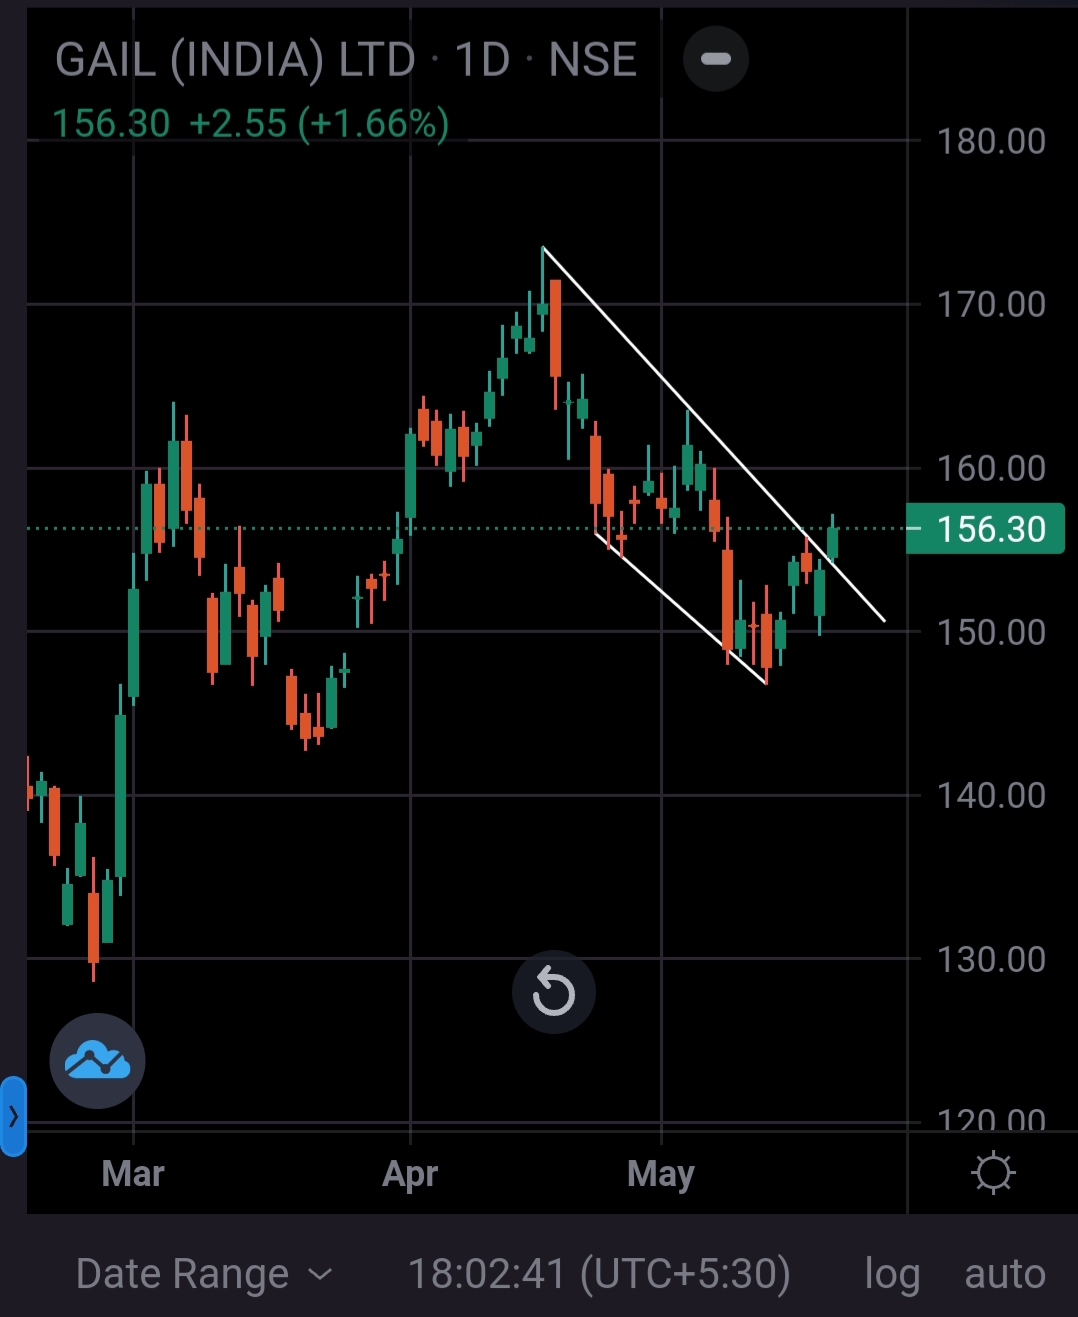
Meanwhile, Bajaj Holdings and Investments and GAIL have shown a similar pattern on their daily charts.
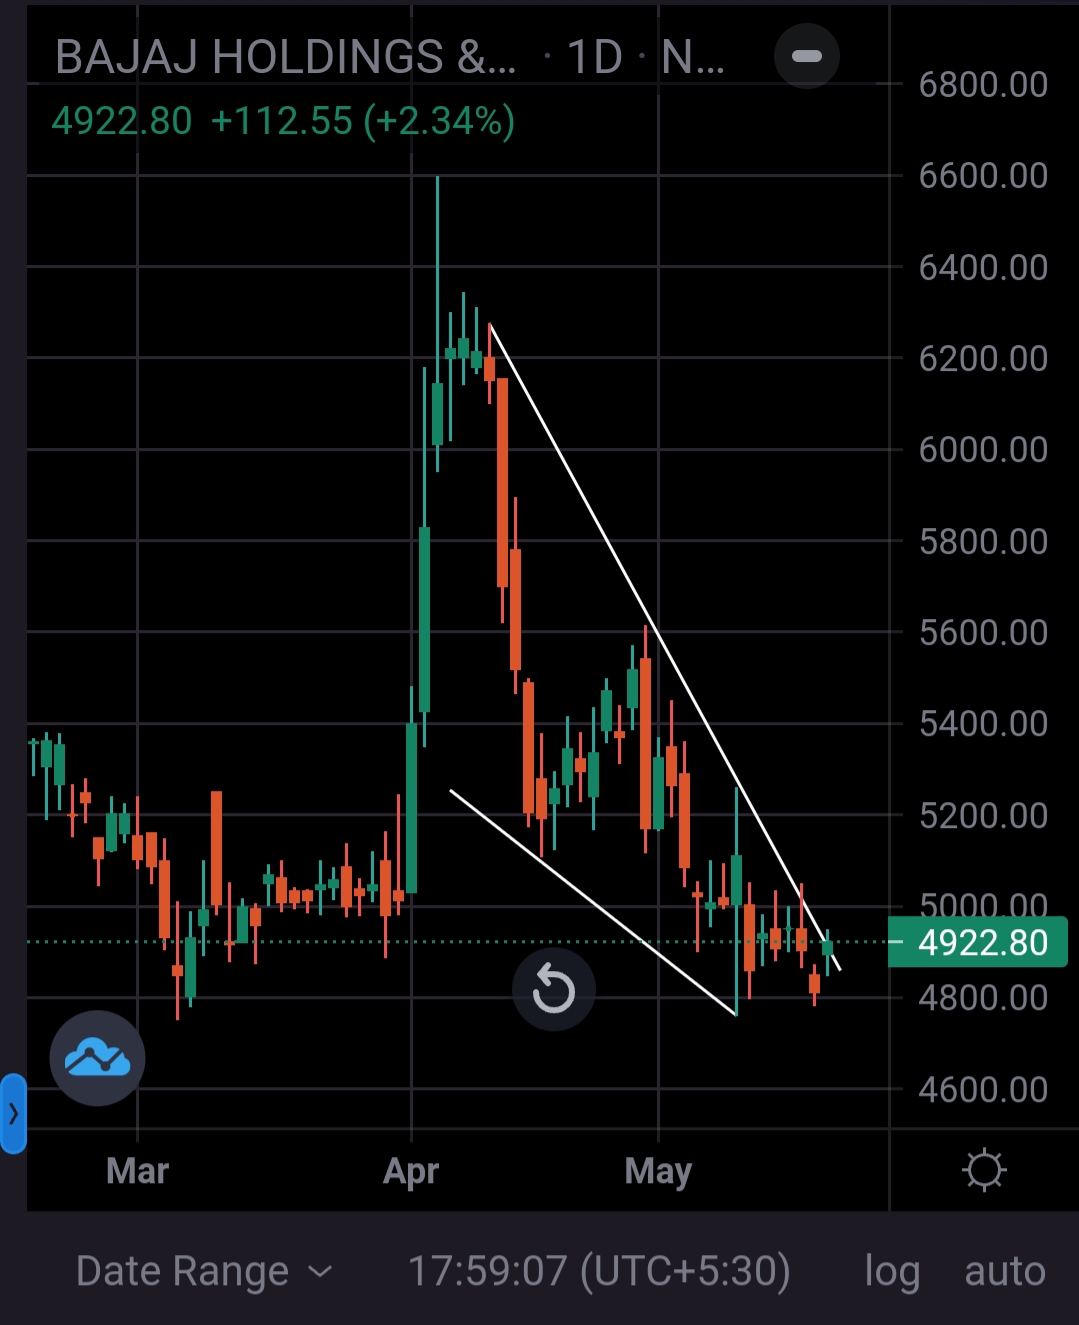
Note: The chart illustrated here is for better understanding and educational purposes only.
 ###### Note: The chart illustrated here is for better understanding and educational purposes only.
Disclaimer
*Derivatives trading must be done only by traders who fully understand the risks associated with them and strictly apply risk mechanisms like stop-losses. *
Wedo not recommend any particular stock, securities and strategies for trading.The securities quoted are exemplary and are not recommendatory. The stock names mentioned in this article are purely for showing how to do analysis. Take your own decision before investing.