Option Buying Strategy using Option Chain Support

Here is a simple intraday trading setup based on the Option Chain analysis technique. The chart timeframe for this intraday strategy is 3 minutes.
You can use this setup to trade stocks and indices that are part of the derivatives segment. Further, you can use any instrument to trade it i.e. cash (equity shares), futures or options. Also, with this strategy you can trade in a bullish as well as a bearish market.
We will use the Option Chain to identify a resistance or support followed by a candlestick pattern to confirm the analysis and trade accordingly. Hence this strategy is going to be a combination of both the Option Chain and a candlestick pattern.
Traders typically analyze option chain as data of writers (sellers). Put writers are bullish, whereas call writers are bearish. If put writers are more than the call writers, then the trend is most likely to be bullish, and if the call writers are more than the put writers, then the trend is most likely to be bearish.
The strike price with the highest figure on the call side open interest column and change in open interest column indicates presence of call writers in that specific strike price which means the call writers are not expecting the price to go above that strike price. The call writers have created a resistance in that strike price.
The strike price with the highest figure on the put side open interest column and change in open interest column indicates presence of put writers in that specific strike price which means the put writers are not expecting the price to go below that strike price. The put writers have created support for that strike price.
In this article, we will be using the Option Chain to identify a support (heavy put writer's presence) in the live market and look for a bullish candlestick pattern to confirm the analysis and take a trade.
Let’s understand the step by step process as to how we analyze and trade this strategy. At the moment, let's look at a call buying strategy using option chain support.
Steps of the setup: We’re analysing the Bank Nifty spot chart in the example below.
Step 1 : We have to look for support using the option chain in the live market. Like I mentioned above, we have to see the strike price with the highest figure on the put side open interest column and change in the open interest column.
Let me show you step 1 analysis with the help of an example.
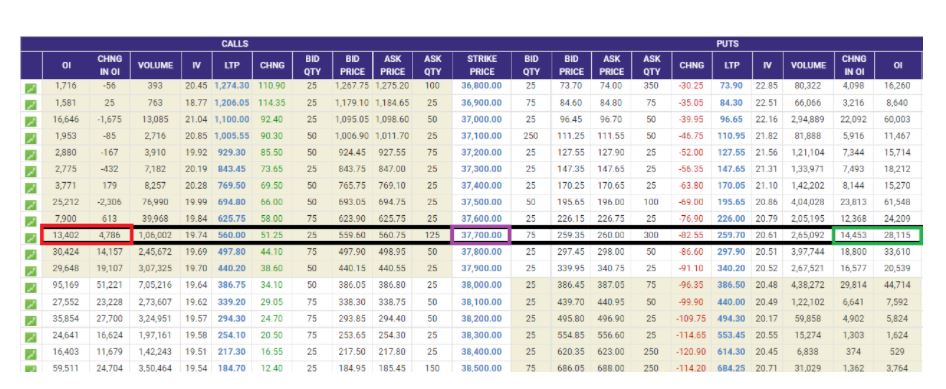
We use nseindia.com for option chain analysis. The above data gets updated every 5 mins in the live market. The above option chain data is of Bank Nifty 24th September (30th September expiry)
The first column is the OI(Open Interest) column and the second column in the Change in OI(Change in Open Interest) column. Let us carefully look at what is happening at the 37700 strike price. We will tell you why specifically the 37700 strike price in the next step of the strategy. If we do a comparative analysis of the call side open interest and the put side open interest on the 37700 strike price, clearly the put writers are stronger than the call writers at 37700. The put side has a significant difference of open interest and change in open interest as compared to the call side open interest and change in open interest. This is indicating that put writers are creating positions at this specific strike price and don’t want the Bank Nifty to go below 37700.
Now**,** why did we choose the 37700 strike? We looked at the Bank Nifty 3 minutes chart and saw some kind of triple bottom support near about 37700 with a strong bullish candlestick pattern
Step 2. We will look at the Bank Nifty spot 24th September 3 minutes chart and look for a bullish candlestick pattern near 37700. We will look at a price chart on Upstox pro web platform.
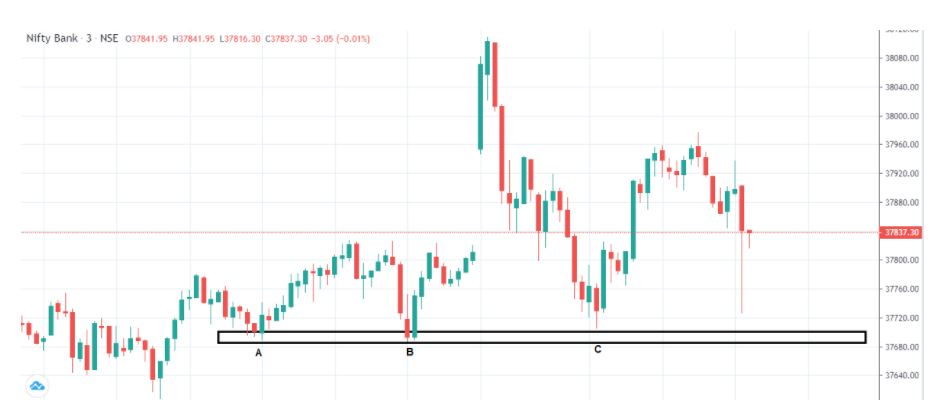
In the chart above we can see the price kept moving up everytime it came near 37680-37700, the zones which are marked in black box. It also formed a triple bottom price action pattern where price rejects from a particular zone not once but 3 times before eventually going up even further.
The C point(third low) of the triple bottom pattern is when we get a morning star pattern which confirms that the price can take support around 37680-37700 levels and go north.
Step 3 : Let's understand with the help of a chart as to what price we enter, where do we keep our stop loss and when do we exit the trade. (target)
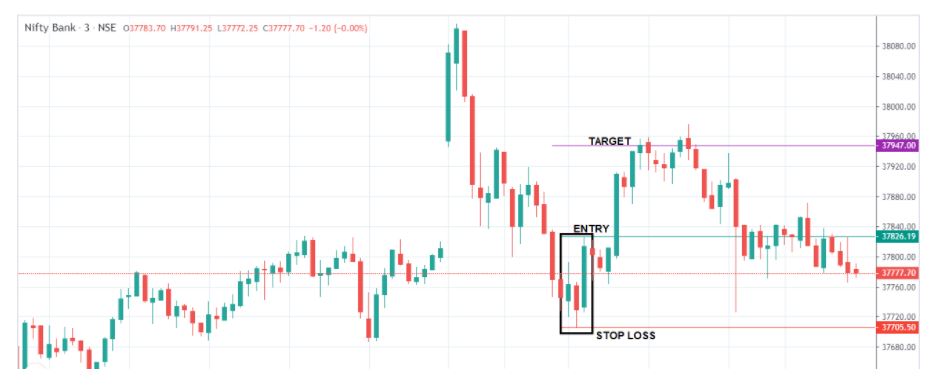
You can see the GREEN line (37826) that's where the morning star pattern was formed after the triple bottom pattern .That is our entry point. We will enter at around those levels of 37826. Since Bank Nifty spot can’t be traded, you can look to trade Bank Nifty futures or options. If you choose to trade options, one way to go about it is that you can buy an ATM (at the money) strike price put option to trade. The market price is 37826 in our example and the nearest strike price seems to be 37800 call option**.** Since it’s an intraday trade , you can go for a weekly expiry rather than a monthly expiry contract.
As far as stop-loss is concerned, you can see the RED line (37705) which is the third low point of the triple bottom pattern . That's 121 points below the entry point of 37826. If Bank Nifty goes below and hits 37705 (our stop-loss) we will take a small loss and exit from our position.
Since it’s an intraday and a quick trade, the timeframe being 3 minutes, we will aim for a risk to reward of 1:1. In our example the risk being 121 points, we will aim for a target of 121 points too from our entry price which comes to 37947 (37826+ 121)
You can see the PURPLE line (37947). Once our price hits 37947, we will exit our 37800 call option position and come out with our profit.
We hope this Option Chain technique strategy was simple and easy to understand.
An interesting article on how to interpret futures open interest coming up very soon.
Happy Trading until then!