
Help Center

Getting Started
Trading
My Account
Mutual Funds
IPOs
Stock SIP
Gold
NPS
Government Securities
Fixed Deposits
Insurance
Loan
Smallcase
DartStock
Upstox API
NCD
US Stocks
How do I set the indicators and apply drawings on Chart 360 web?
Chart 360 Web is improving the trading experience with a full suite of tools available to apply things like technical indicators and drawings directly on the chart. This feature allows clients to conduct in-depth market analysis and trade based on their analysis.
To apply Indicators:
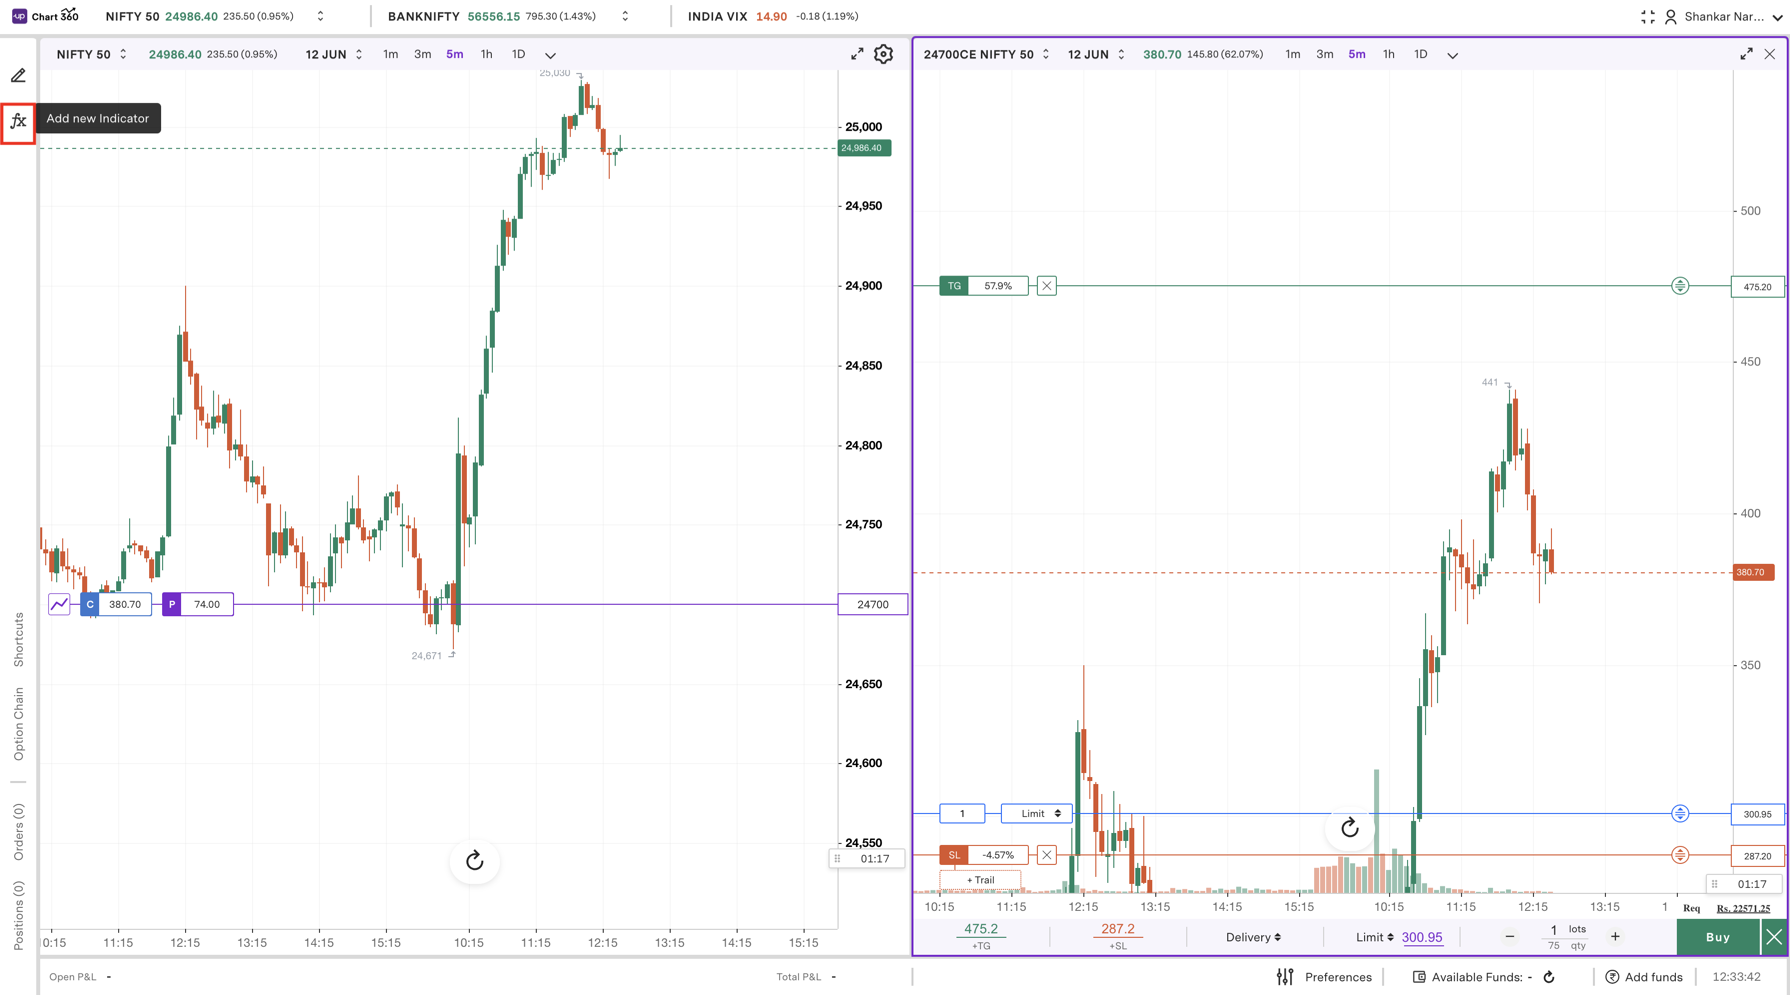
Step 1: Open the chart for any strike or index on which you want to apply indicators.
Step 2: Click on the ‘fx’ icon on the left side of the page, which is the indicator panel.
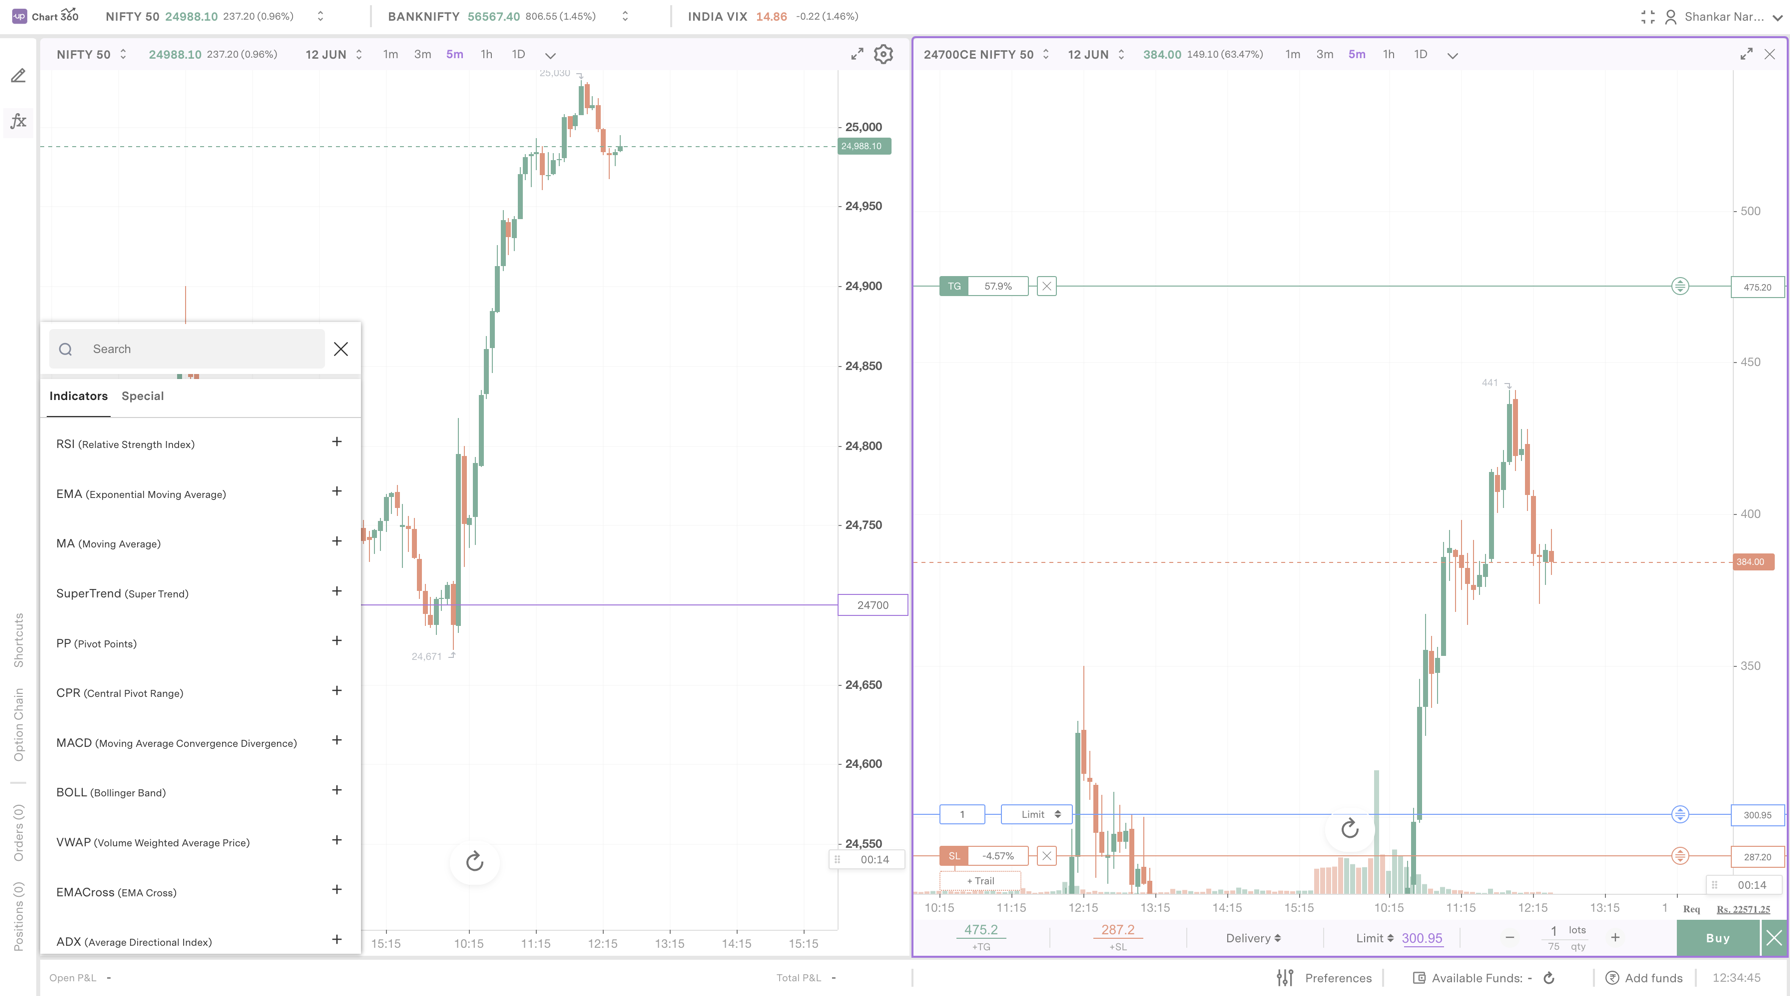
Step 3: A panel will be displayed that lists popular indicators found on the Chart 360 Web, such as RSI (Relative Strength Index), EMA (Exponential Moving Average), MACD (Moving Average Convergence Divergence), SuperTrend, VWAP, and others.
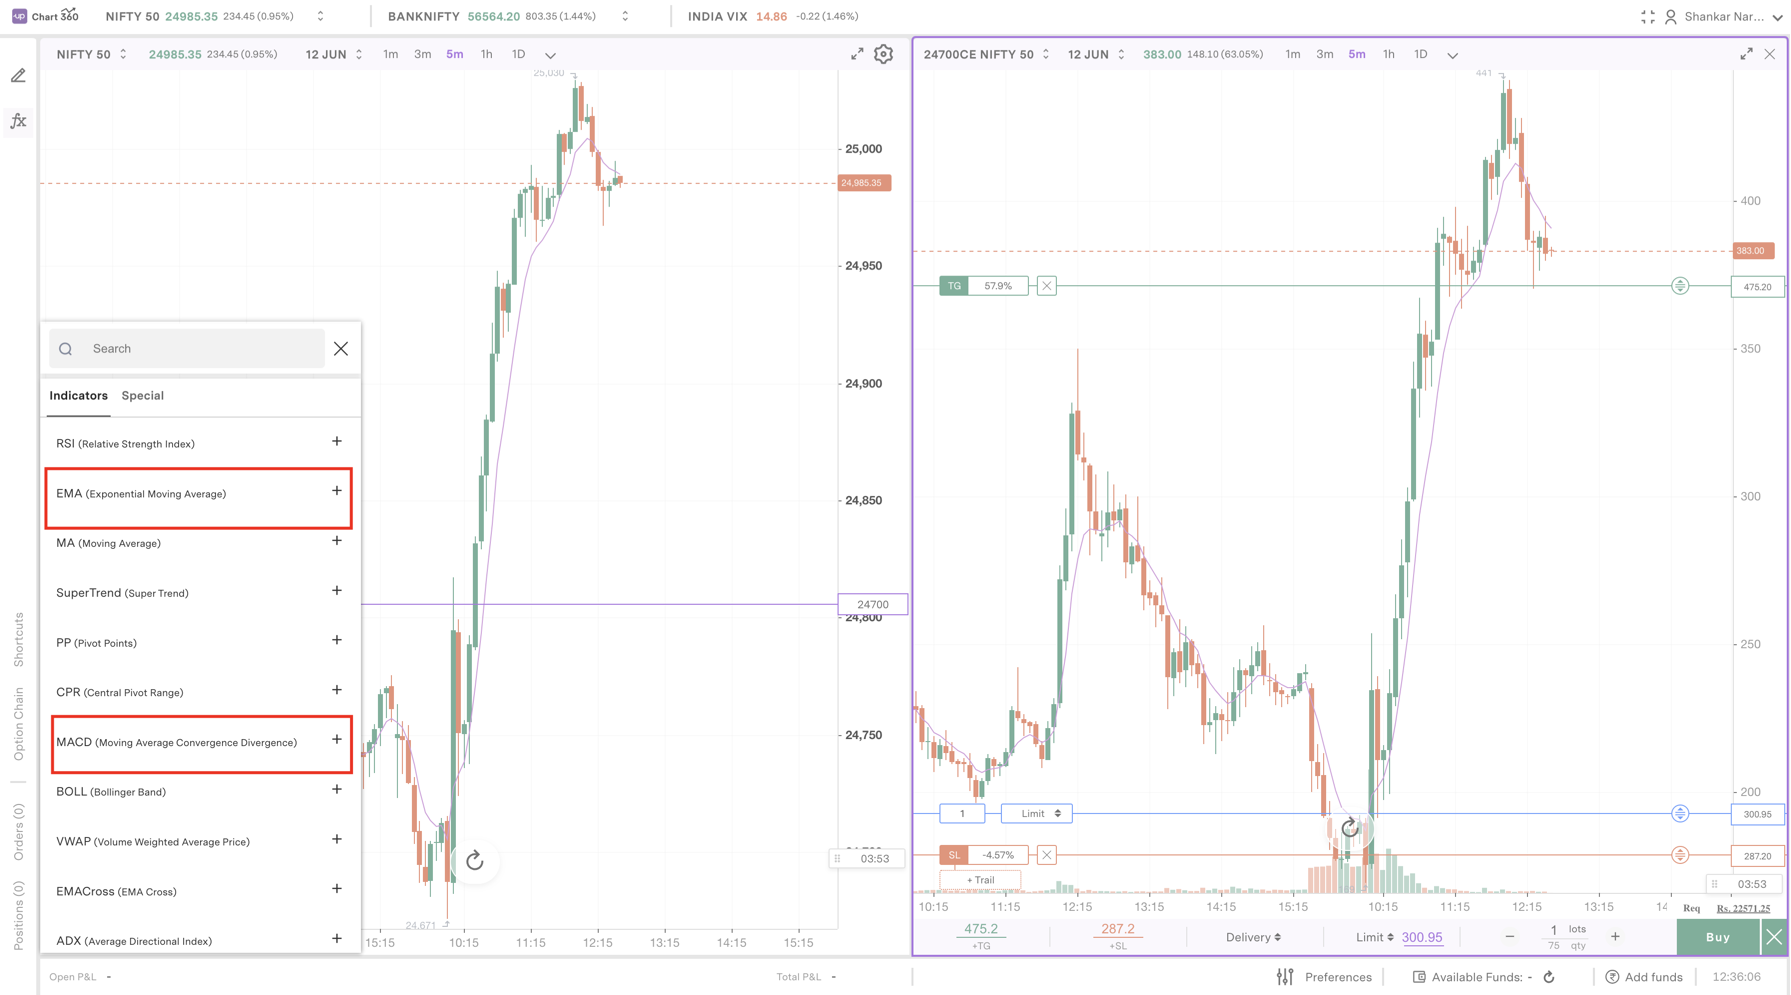
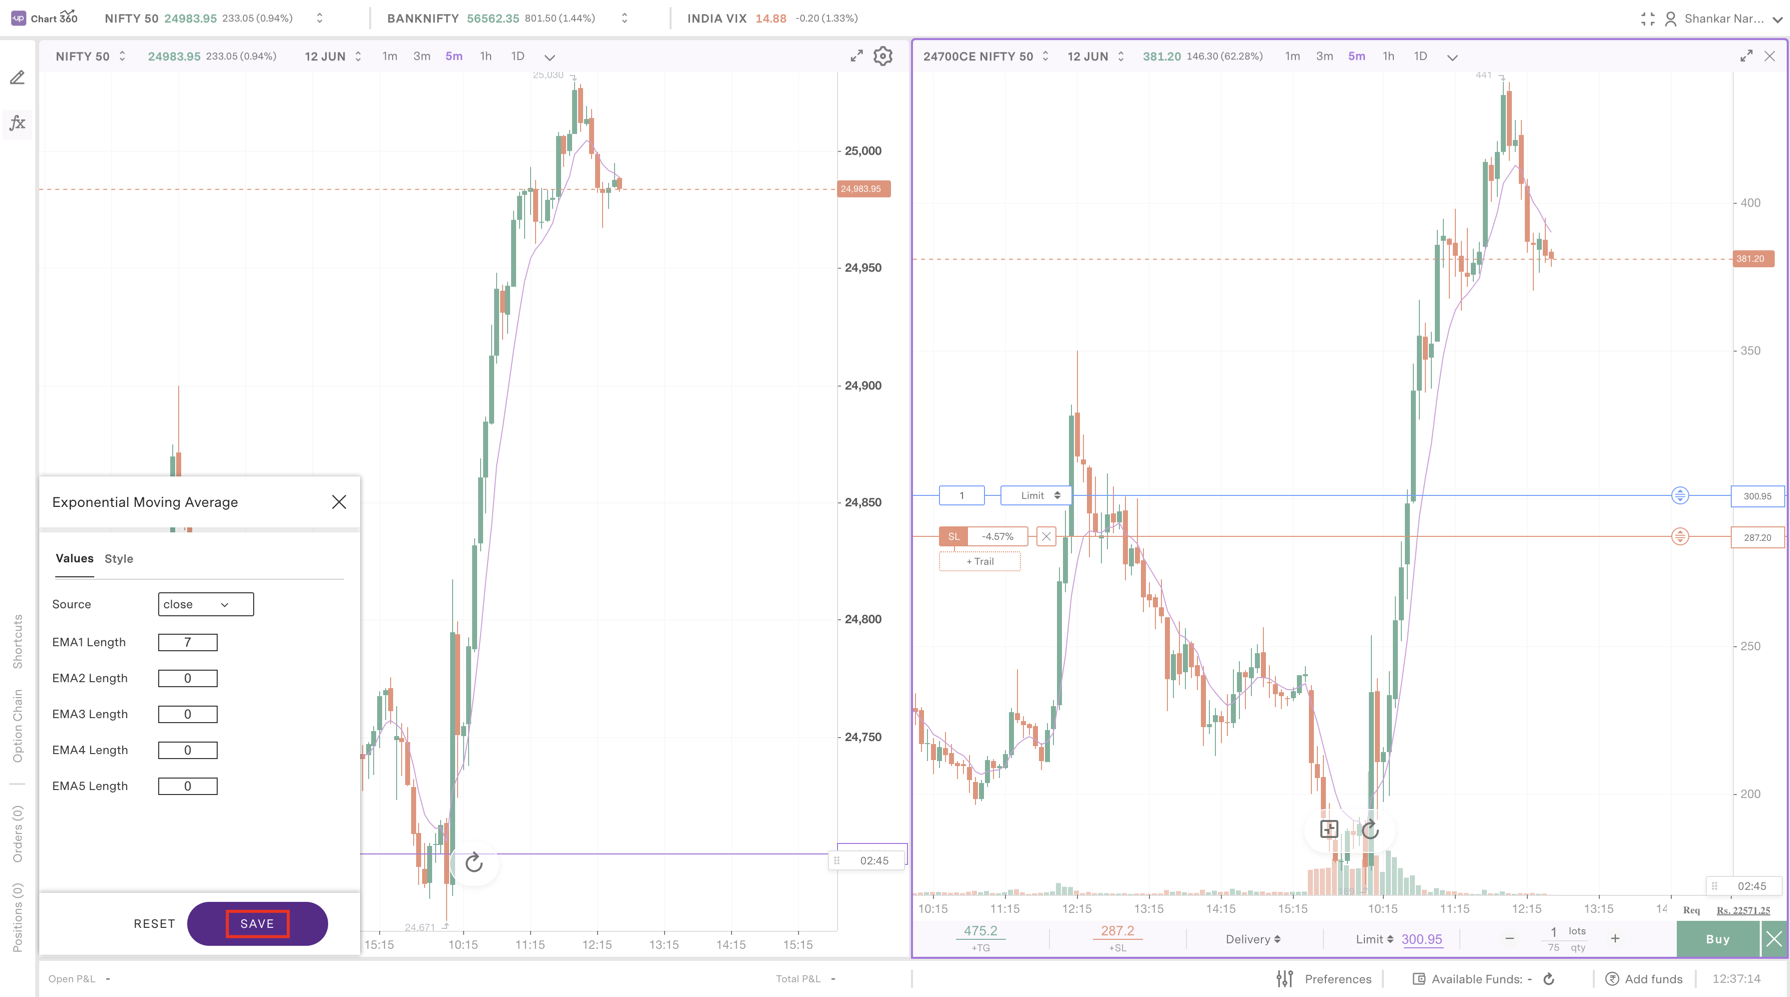
Step 4: Click the ‘+’ button beside any indicator you would like to use. The selected indicator will then be applied to your chart immediately, allowing for immediate trend, momentum, and price analysis.
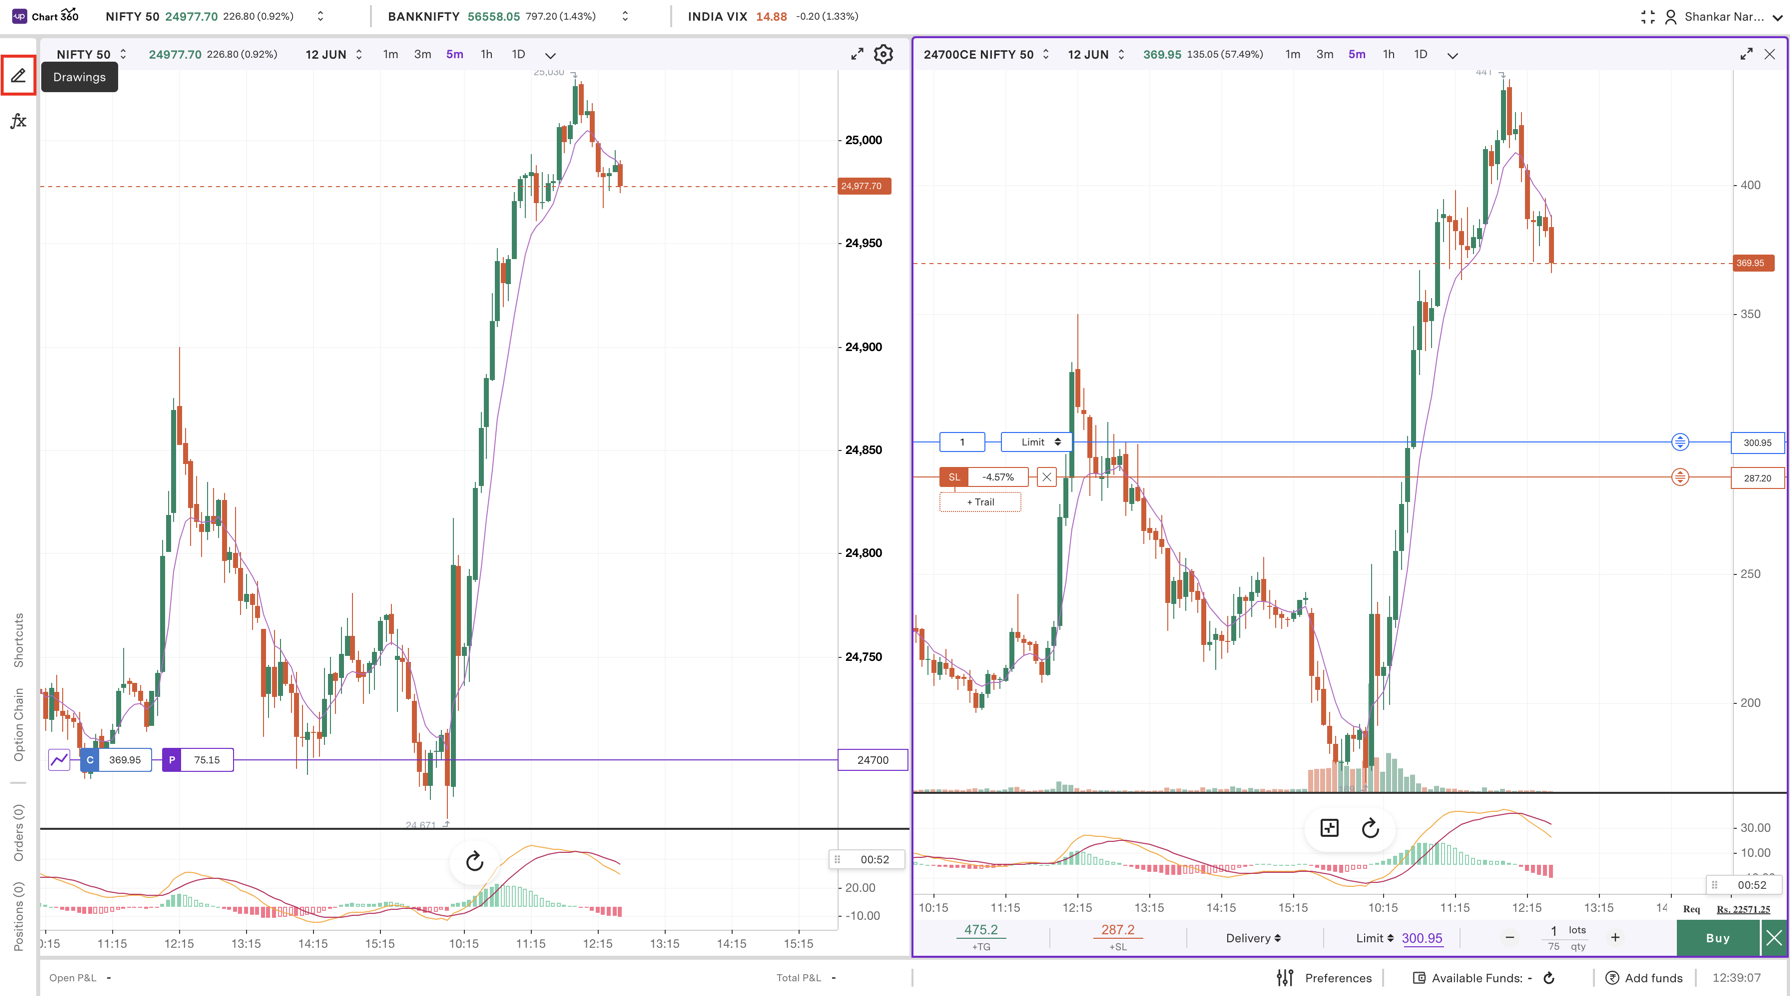
To apply Drawings:
Step 1: Click the pencil icon on the left side of the chart view to bring the drawing tools.
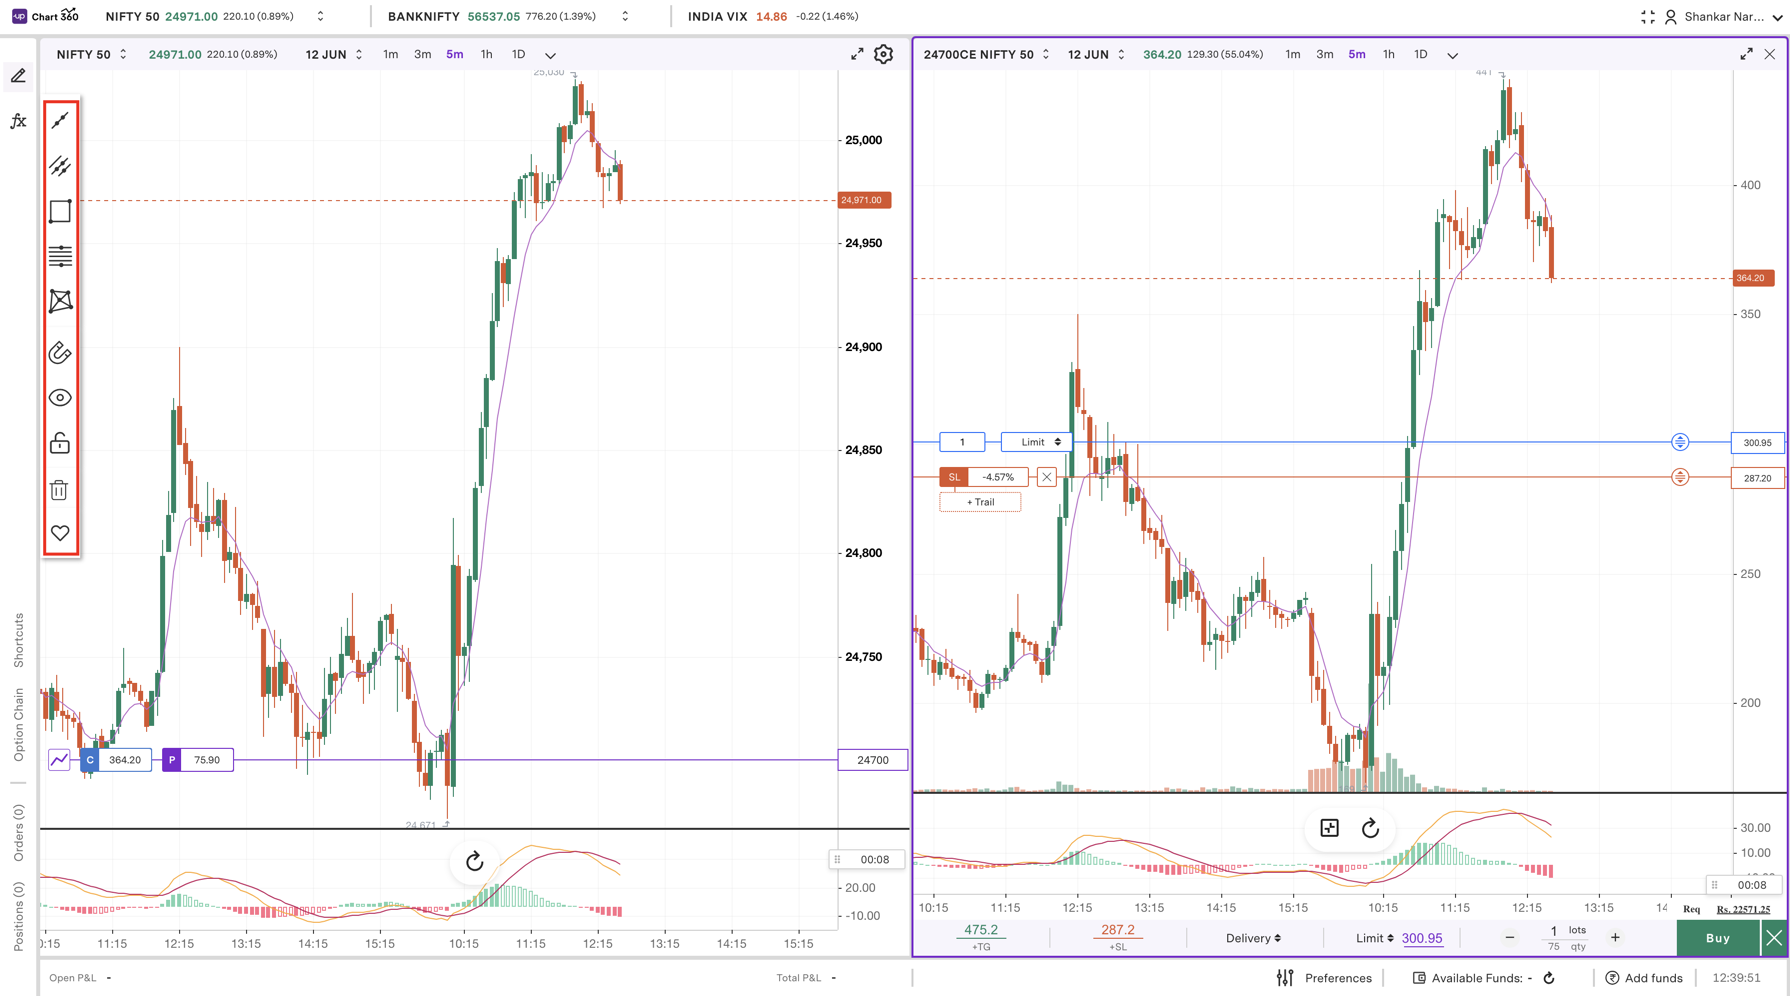
Step 2: Choose from a variety of drawings as per your need, such as Trendline, Horizontal Line, or Rectangle, to analyse.
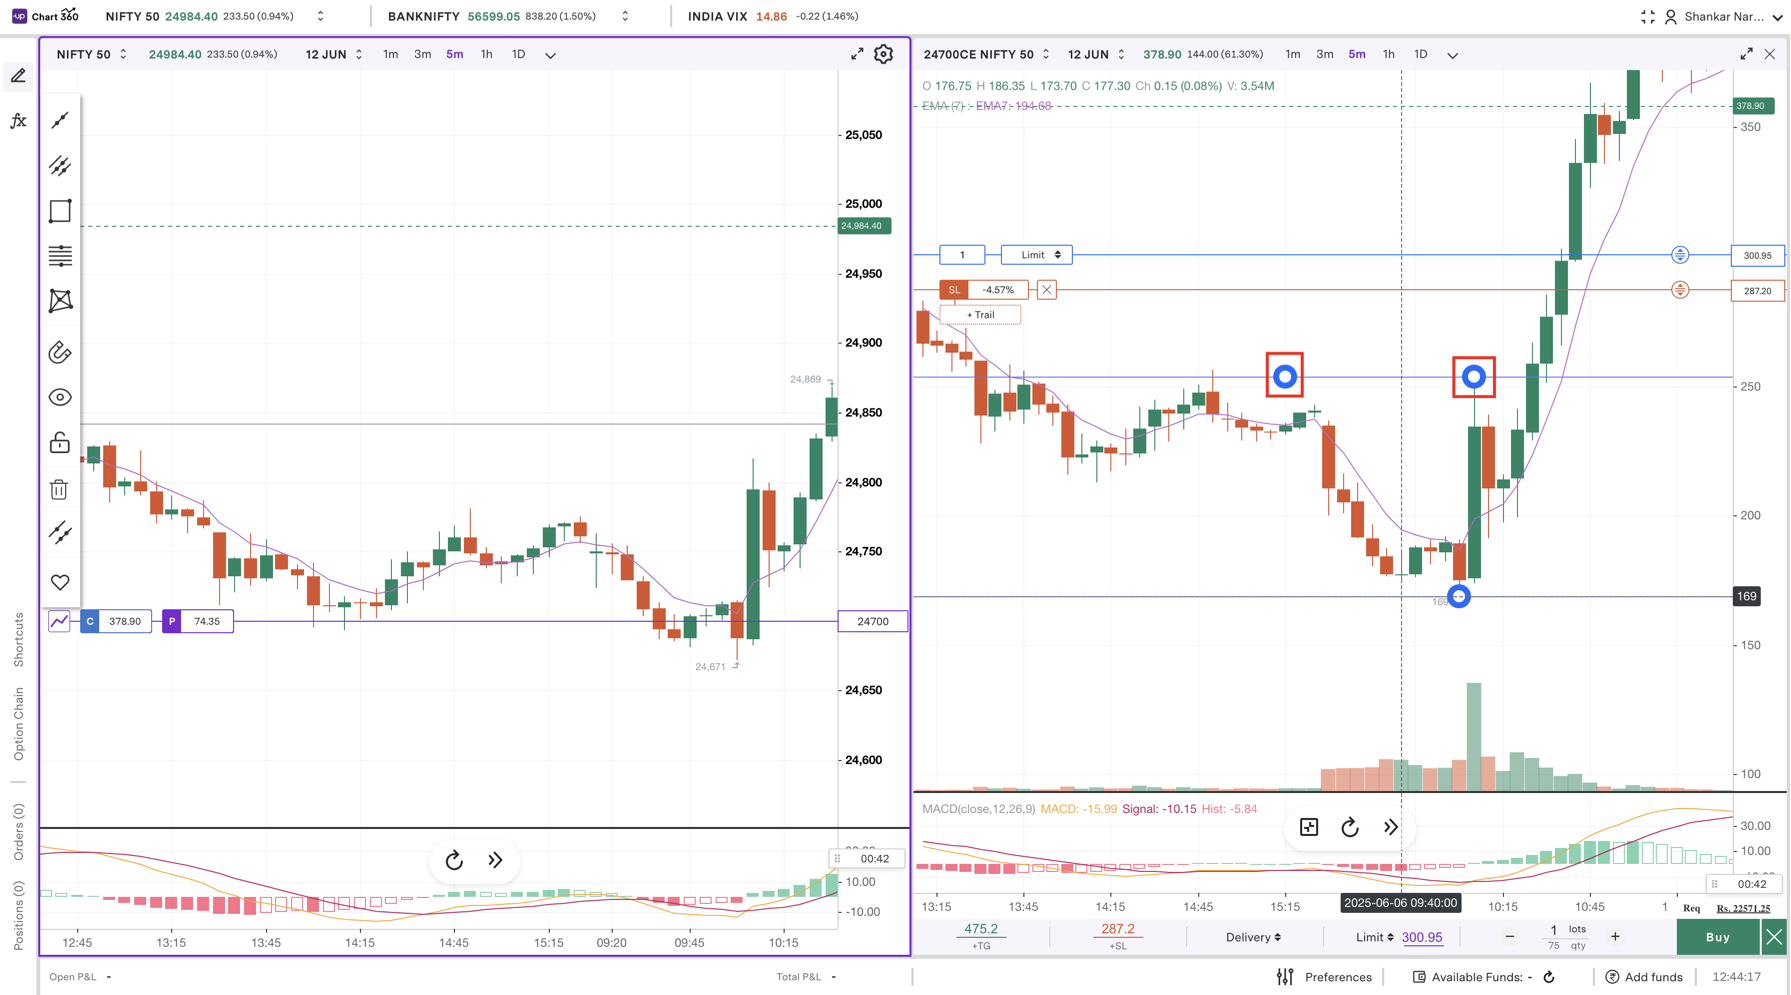
Step 3: Click and drag on the chart to place the drawing precisely where desired.
Step 4: To edit/remove an existing drawing, just click the drawing and the toolbar will appear to amend.
Trade with Upstox
Want to open a Demat account?
Open a FREE Demat and Trading account to invest in Stocks, Mutual Funds, IPOs and more.
By signing up you agree to receive transaction updates on Whatsapp. You may also receive a call from an Upstox representative to help you with the account opening process.
Upstox Community
Upstox Community
| Topic | Replies | Views | Activity |
|---|