What are market indicators?
Are you on the lookout for parameters to gauge future market movement?
Well, we got you covered! These parameters are known as market indicators.
Market indicators are quantitative tools used by traders to forecast market movement. This in turn helps them determine their entry and exit points of a trade. Market indicators comprise of formulas and ratios.
Understanding market indicators
No market indicators by itself will provide the trader with a complete picture. So these are used in various combinations. There are a multitude of market indicators in the stock market. Here are a few to get you started:
-
Moving Averages
Which is a key factor in determining if a trade is profitable?
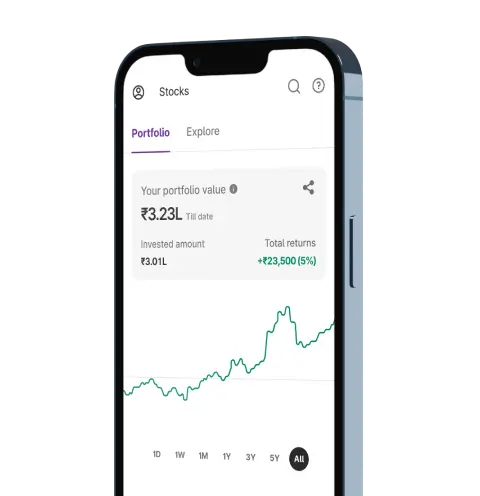
Price of course! And moving averages help the trader to understand this price movement over a period of time. It is expressed as a single flowing line representing the average price of a stock over a period. During market hours, moving average helps to level the price data over a specified period by creating a constantly updated average price. Traders can use 5, 15, 50, 100 and 200 day moving averages depending on their trading time frame.
Interpretation:
Moving averages do not forecast future price movements. They simply show the real price movements that have already occurred.
It is used to understand the range of price movement of a stock based on past data, so selection of the duration is of critical importance. It can be as low as 1 day or one week and as high a 5-year, 10- year or Year to date.
2. Market Breadth
Have you ever noticed that when the Nifty50 Index is rising, not all the stocks in it are in the uptrend? Neither are all stocks in the downtrend when Nifty50 Index is falling. It is at times affected by a large movement in a few stocks. Market breadth analyses the number of stocks advancing as compared to those that are declining in a given index. There are various market breadth indicators such as the advance/decline ratio.
Interpretation:
Market breadth indicators are used to monitor for confirmation and divergence.
- Confirmation is when the indicator is moving favourably and the index is rising.
- Divergence is when the index and indicator move in opposite directions. This indicates that the index may see a reversal soon.
3. Open Interest
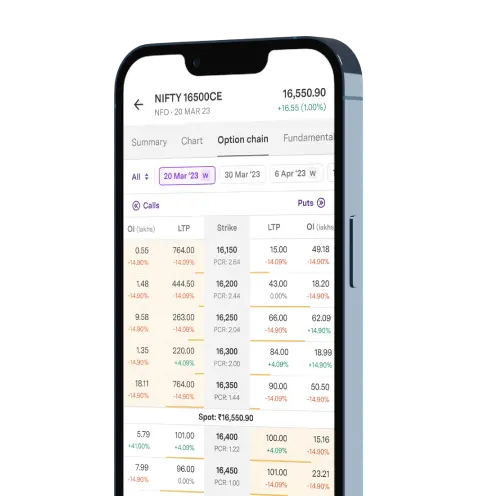
Open interest (OI) is an indicator that refers to the total number of outstanding derivative contracts such as options and futures. Simply put, these contracts are not settled at a given point in the market. The OI equals the total number of contracts that have a buyer and a seller. Open interest in the share market is also a good indicator of the prevailing liquidity in the market. Open interest reveals whether positions are increasing or decreasing in the market.
Interpretation:
Open interest analysis can be done by comparing OI to another variable which is price. Now, we can interpret the kind of activity that is taking place in a stock. Open interest is also a good indicator of prevailing liquidity. The OI build-up in turn is a good indicator for gauging underlying market sentiment. This results in four combinations:
Open Interest | Price | Indicator | Action |
Increases | Increases | Bullish | Long build-up |
Decreases | Decreases | Cautiously bearish | Long unwinding |
Increases | Decreases | Bearish | Short build-up |
Decreases | Increases | Cautiously bullish | Short covering |
Open interest helps to estimate the immediate support and resistance levels in the market.
How to recognise immediate resistance level?
In case of call options, a seller sells the call options when he or she thinks that the stock will not rise above a certain level.The trader takes unlimited risk, hoping that he or she will profit from the stock trading and expiring below their strike price. The call option strike price at which the biggest open interest builds up acts as its immediate resistance.
How to recognise immediate support level?
In put options, a seller sells the put options when he or she feels that the stock will not decline further beyond a certain level. In case, if the stock goes down, the risk or losses will increase. This is why a trader will prefer to sell stock at the level at which he or she thinks the stock will ‘hold’ and ‘take support’. The strike price of a put option, at which there is the largest open interest buildup, acts as its immediate support.
4. PCR
PCR stands for Put Call Ratio. It is simply put the total number of puts dividend by the total number of calls.
PCR =Total number of Puts
Total number of Calls
Let's understand this with the help of an example: In a particular contract, if there are 2 lakh open put option positions and 1 lakh open call option positions, this will have a PCR of 2.
PCR is a sentiment Indicator and this is used in a contrarian fashion.
Interpretation:
-
High PCR
A high PCR indicates that the market is in an overbought territory. Generally, if its range is 1.4, 1.5 or higher, the market is seen as overbought. Here, a trader can look for selling opportunities in the market.
-
Low PCR
A low PCR is an Indicator of an oversold market. If it is in the range of 0.6 and 0.7, it is seen as oversold. Here, a trader can look for buying opportunities in the market.
PCR Range | Interpretation | Lookout for |
1.4-1.5 | Overbought Territory | Selling Opportunity |
0.6-0.7 | Oversold Territory | Buying Opportunity |
5. VIX
VIX stands for Volatility Index. VIX measures the volatility of the market, i.e. how big are the movements that are taking place in the market.
Like PCR, VIX is also a contrarian sentiment Indicator.
Interpretation:
- VIX is high and increasing: If VIX is high and is moving upward, it usually indicates that the market is falling or trending downwards.
- VIX is low and decreasing: If VIX is low and is moving downward, it usually indicates that the market is rising or trending upwards.
VIX has a range of about 13-18. But this is not set in stone, which means VIX can move beyond this.
VIX Range | Interpretation |
13 or trending down | Market trends Upwards |
18 or trending up | Market trends Downwards |
Volatility is one of the factors for options pricing so it can also be interpreted as follows:
- High Volatility: When volatility is high, options are more expensive so traders deploy option selling strategies.
- Low Volatility: When volatility is low, options are comparatively cheaper so traders deploy options buying strategies.
Volatility | Premium | Strategies deployed |
High Volatility | Higher Premium | Option selling strategies |
Low Volatility | Lower Premium | Option buying strategies |