What is a Buy Signal in Investing?
Summary:
Buy signals are market indicators that highlight favourable asset buying trends in the market. There are several factors that influence buying signals and investors need to be careful while interpreting buying signals. You must understand the concept in-depth and explore the common examples to build up understanding.
In investing, a buy signal is a sign that indicates a favourable time to purchase a financial asset such as stocks, bonds, or other securities. Typically, buy signals are generated by either analysing market data, using technical indicators, through fundamental factors, or by a combination of all these. Traders and investors can use buy signals to make informed decisions about entering a long position for a particular asset.
Common examples of Buy Signals
Let us explore some of the most common types of buy signals:
- Technical Indicators: Technical indicators are the visual representations of market data through mathematical calculations. Traders and analysts use technical indicators to understand and interpret the financial market including trends and price movements. Being based on historical price and volume data, technical indicators assist traders in informed decision-making, for example, about buying or selling financial instruments. The most common technical indicators include:
- Moving Averages: A buy signal is generated by a crossover of short-term moving averages above long-term moving averages that indicates a potential upward trend.
- Relative Strength Index (RSI): An asset is considered oversold if the RSI values dip below a certain threshold. This potentially signals a buying opportunity.
- Chart Patterns: Chart patterns are recognizable formations on price charts. Traders and analysts use chart patterns to identify the consolidation of a financial instrument's price movement, potential trend reversals, or continuations. These patterns are generated by the repetitive behaviour of market participants. Their recognition also provides insights into price movements in future. In technical analysis, chart patterns are often used to make informed decisions about purchasing or selling assets. Common chart patterns include:
- Double Bottom: This potentially signals a reversal of a downtrend, indicating an opportunity to purchase.
- Cup and Handle: This can be interpreted as a bullish signal, suggesting a potential price movement that’s upward.
- Fundamental Factors: The elements that influence the intrinsic value of a financial asset, such as stocks, bonds, or commodities are considered fundamental factors. These can be economic, financial, or even qualitative factors. Analysis of fundamental factors is leveraged by investors and analysts to assess an asset’s underlying health and performance. The goal of this is to determine its true or fair value in the market. Fundamental factors can encompass a wide range of information that aid investors in informed decision-making about purchasing or selling assets. They include:
- Earnings Reports: A fundamental buy signal can be a report of positive earnings or financial performance that is better than expected.
- Dividend Increases: A company announcing an increase in dividend can also be construed as a positive signal. This is especially applicable for income-focused investors.
- Market Conditions: The prevailing situational, financial, and economic factors that have an influence on how financial markets behave are referred to as market conditions. Market conditions have an impact on pricing, volatility, and the overall environment in which stocks, bonds, currencies, commodities, and other assets are traded. For analysts, traders, as well as investors, understanding market conditions is a crucial step in making decisions about purchasing or selling financial instruments. Buying signals pertaining to market conditions include:
- Bullish Trends: Indicates a general uptrend or bullish market and is considered a buy signal to leverage the positive momentum.
- Positive Economic Data: GDP growth, low unemployment, or other strong economic indicators signal a healthy economy and offer buying opportunities to market participants.
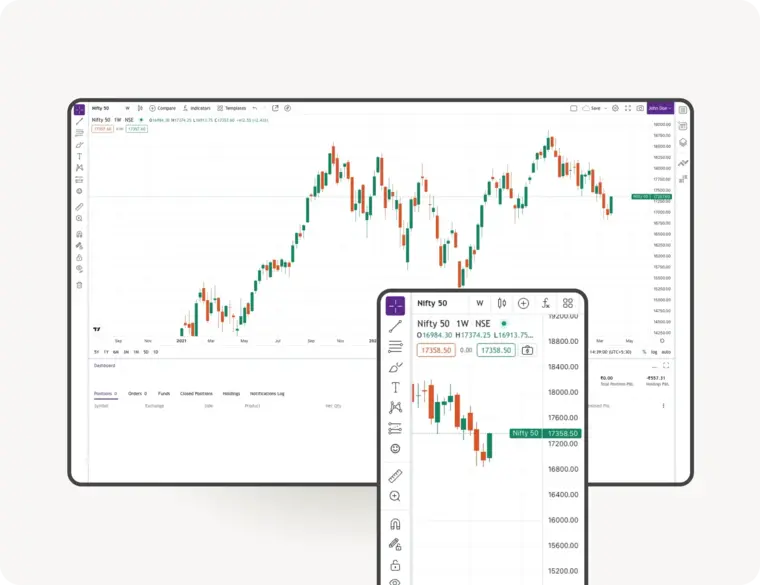
- Candlestick Patterns: Market analysts plot the price movements of assets on a financial chart to technical analysis or to interpret the prevailing market sentiment to predict potential price changes. These visual representations are called candlestick patterns, each of which represents a specific period. Moreover, the shape and colour of the candlestick indicate trends around opening, closing, and high and low prices within a specific timeframe. Candlestick patterns are used by traders and analysts to identify market indecisions, continuations, as well as trend reversals. Common candlestick pattern-based buying signals include:
- Bullish Engulfing Pattern: When a large bullish candle fully engulfs the previous bearish candle, a bullish engulfing pattern emerges. This suggests a potential reversal and a buy signal.
- Hammer or Inverted Hammer: You can find this at the bottom of a downtrend. Usually, a hammer or inverted hammer indicates potential buying interest.
In conclusion
Market entrants and investors must note that no single buy signal guarantees success in investing. Experienced traders and investors often resort to a combination of signals complemented by robust analysis to make well-informed decisions. Additionally, factors such as time horizons, investment goals, and individual risk tolerance also play a critical role in determining the feasibility and usability of a buy signal for each unique investor.
Typically, investors should use a disciplined approach and weigh in multiple factors before finalising buy decisions and enhancing the chances of successful investing. If you are still unsure about interpreting buying trends, consulting a financial advisor can be fruitful.