Upstox Originals
NSE versus the world: Scale, profitability and the IPO premium

10 min read | Updated on September 21, 2026, 12:39 IST


SUMMARY
NSE already processes more derivatives contracts than any exchange in the world, yet it earns far less per trade than major global players. As the exchange heads towards its listing, investors face a key question: is this merely a high-volume trading platform or a future financial infrastructure powerhouse? The answer could determine whether its valuation premium is justified.
Stock list
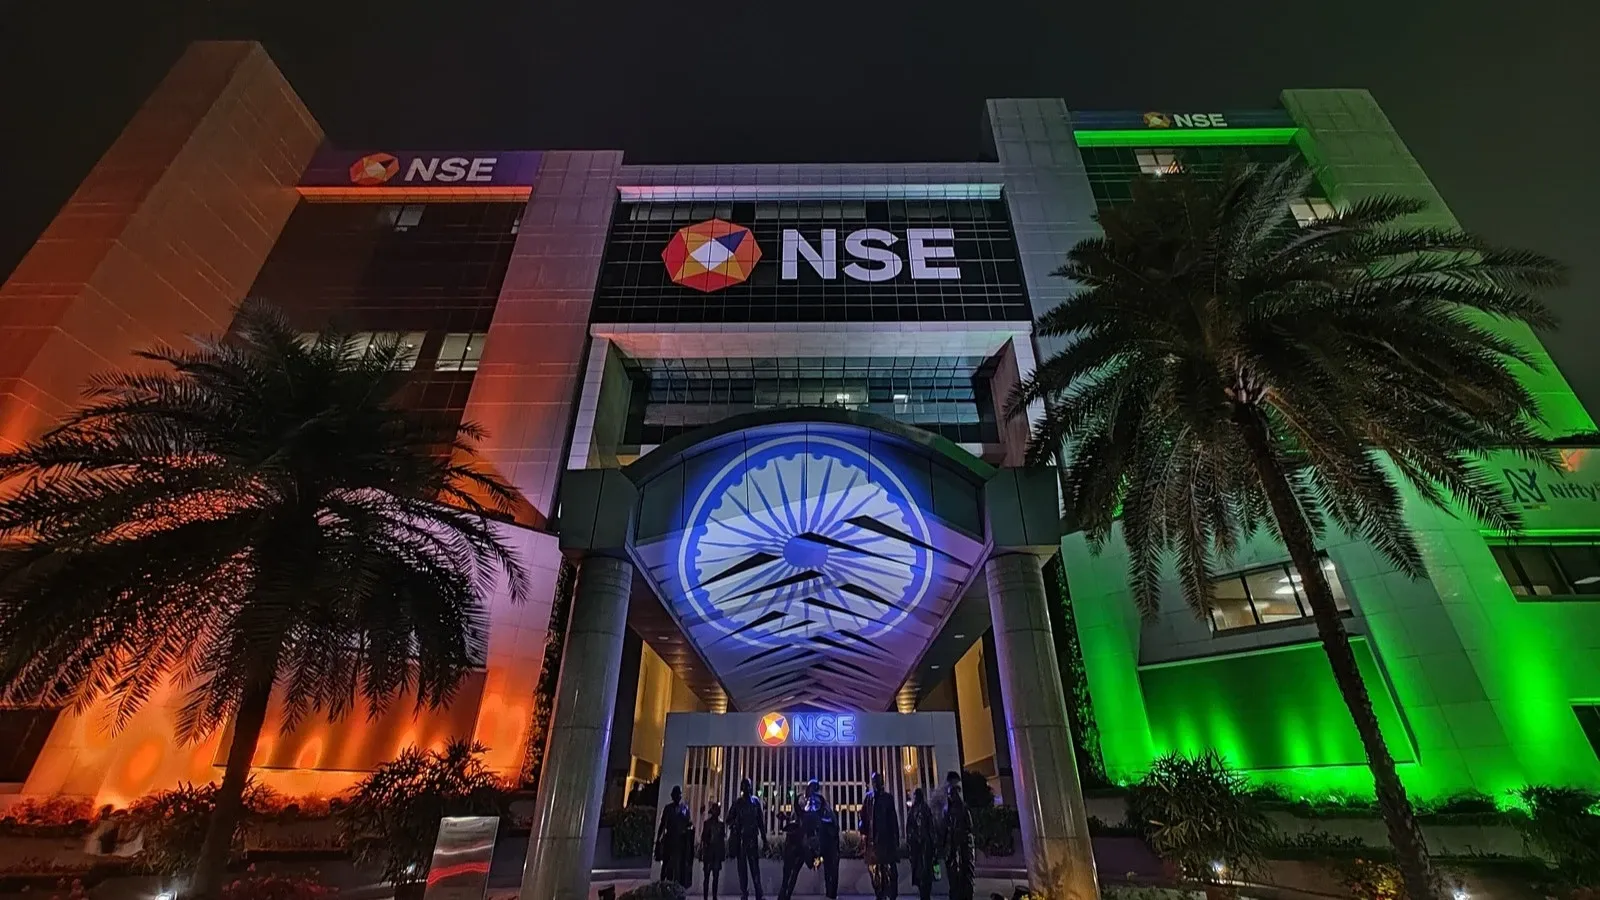
NSE handles more derivatives trades (by volume) than major US exchanges such as Nasdaq and CBOE. | Image: Shutterstock
An exchange based in Mumbai's Bandra Kurla Complex already handles more derivatives contract trade (by volume) than major US exchanges such as Nasdaq, ICE (Intercontinental Exchange Inc) and CBOE (Chicago Board Options Exchange). Yet the value generated per derivatives contract and the range of products available in India remain below mature markets.
That contrast is the best way to understand NSE as it moves towards its long-awaited listing. NSE is clearly large. The real questions are what kind of exchange it is, how it compares with CME Group and HKEX, and where future growth may come from. What makes an exchange valuable
Trading volume once defined an exchange's value. Today, it is only part of the story. CME Group (United States), ICE (United States), LSEG (United Kingdom) and Nasdaq (United States) also earn from index licensing, market data, analytics and technology services. Trading remains central, but these businesses add recurring revenue and high margins.
NSE is different. Most of its revenue comes from transaction charges. It focuses on one fast-growing domestic market and operates with one of the leanest cost bases among its peers.
Scale is not the same as value
NSE's size is clearest in trading activity. It processed 36.99 billion equity derivatives contracts in FY26, and ranked first globally by contract count.
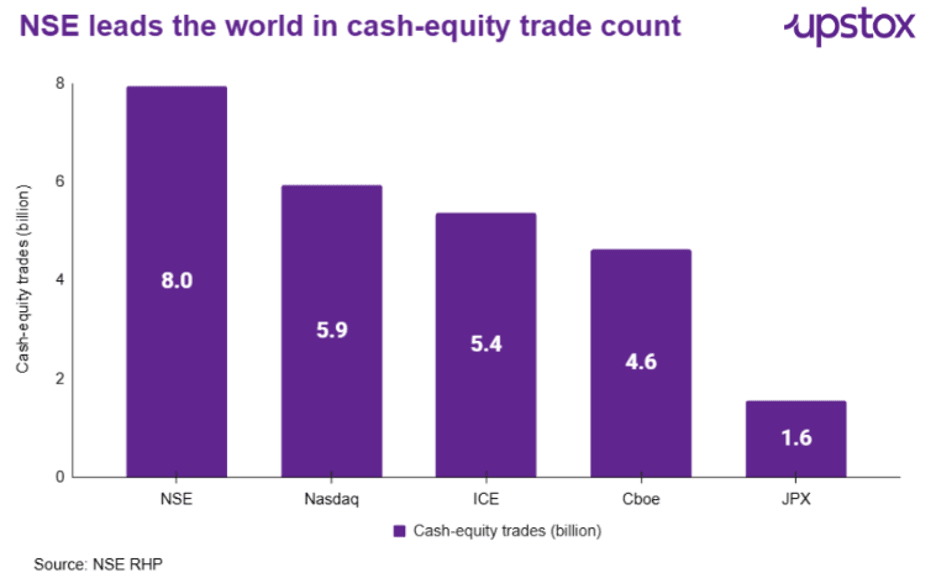
Equity index options alone accounted for 34.69 billion contracts and 89.02% of the global count in that category. NSE also processed 7.95 billion cash-equity trades, more than any peer in the comparison.
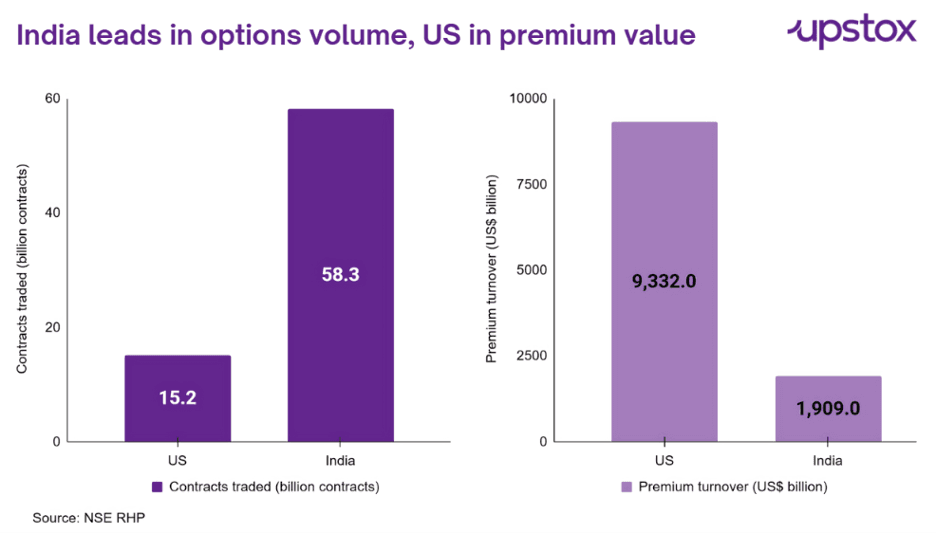
The number of contracts does not show their full economic value. Indian contracts are much smaller than US contracts. In 2025, India traded 58.3 billion options contracts against 15.2 billion in the US.
However, India's premium turnover was US$1.91 trillion, compared with US$9.33 trillion in the US. Based on June 2026 contract specifications and index levels, a typical SPX option contract represented roughly 40 times the economic exposure of a Nifty option contract.
NSE's profitability rank among listed peers
High trading volumes become more valuable when the exchange can handle them without costs rising at the same pace. NSE's lean operating model converts its scale into unusually strong margins. The table below shows that NSE ranks first among listed peers on adjusted operating EBITDA margin and third on both profit after tax margin and return on average equity.
| Metric | NSE FY26 | Global rank |
|---|---|---|
| Adjusted operating EBITDA margin | 75.48% | 1st |
| Profit after tax margin | 55.05% | 3rd |
| Return on average equity | 32.98% | 3rd |
Source: Redseer Industry Report
Profitability is only one part of the comparison. NSE's FY26 total income of US$2.12 billion was much lower than ICE, LSEG, Nasdaq and CME Group. However, its four-year income CAGR of 20.51% was faster than each of these larger peers. NSE is therefore smaller by revenue, but it has been growing faster.
How the business model compares
The peer table shows the trade-off clearly. NSE has the lowest income in this selected group, but the fastest growth and the highest adjusted EBITDA margin. CME Group and HKEX come closest on profitability. ICE, LSEG and Nasdaq are much larger because they own broader data, technology, clearing and post-trade businesses.
| Exchange | Income US$bn | Income CAGR | Adj EBITDA margin | PAT margin | Business mix |
|---|---|---|---|---|---|
| NSE | 2.12 | 20.5% | 75.5% | 55.1% | India-focused trading, clearing and market infrastructure |
| ICE | 12.81 | 8.7% | 51.9% | 26.3% | Exchanges, clearing, fixed income, data and mortgage technology |
| LSEG | 12.66 | 9.6% | 46.9% | 15.8% | Data and analytics, indices, clearing and trading venues |
| Nasdaq | 8.30 | 9.0% | 37.1% | 21.5% | Market services, capital access and financial technology |
| CME Group | 6.52 | 8.6% | 69.9% | 62.5% | Derivatives, clearing and market data |
| HKEX | 4.02 | 11.5% | 73.2% | 57.0% | Trading, clearing, listings, connectivity and data |
Source: Redseer Industry Report
The largest difference is revenue mix. Mature exchange groups earn recurring fees from data, indices, software, clearing and post-trade services. LSEG is the clearest example. Information services contribute more than 70% of its group revenue after the Refinitiv acquisition. NSE is still led by trading. Transaction charges made up 78.65% of FY26 operating revenue, while options alone contributed 60.22%.
What makes NSE structurally different
-
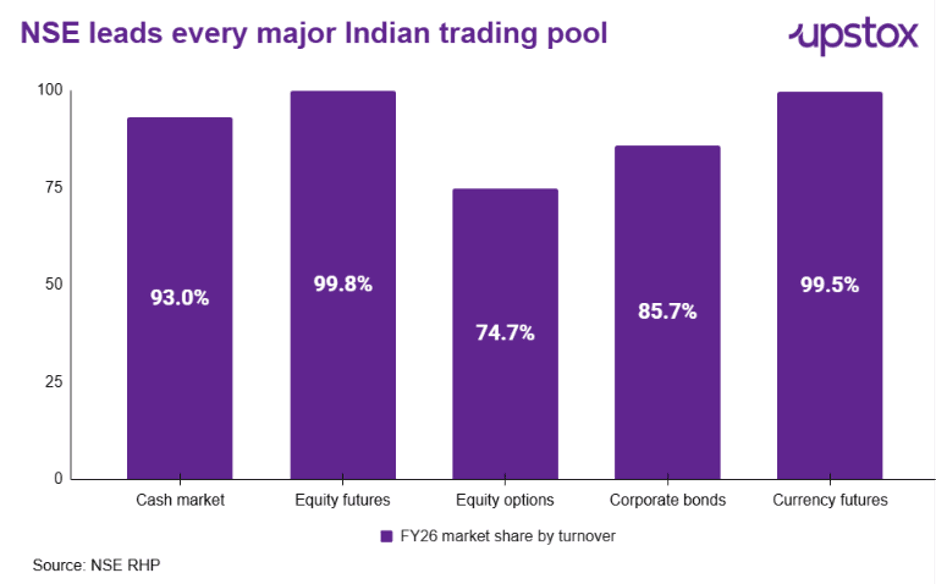
Liquidity is the core moat. NSE held 92.99% of Indian cash market turnover, 99.79% of equity futures turnover and 74.71% of equity options premium turnover in FY26. Its position spans both retail-heavy and institutional products.
-
Technology converts scale into margins. The platform processed 12-14 billion messages a day on average in FY26 and reached a peak of 21.89 billion messages in one day. It can process about five million messages a second. Once this infrastructure is in place, extra volume can be handled at a relatively low additional cost.
-
Vertical integration captures more of each trade. NSE operates across trading, clearing, settlement, indices, data, connectivity and international markets. These activities are split across different companies in several developed markets. NSE's structure supports a 75.48% adjusted operating EBITDA margin, the highest in the report's global comparison.
-
India keeps adding participants. Unique investors registered with NSE rose from 39.89 million in March 2021 to 129.09 million in March 2026. Demat accounts across Indian depositories rose from 55.13 million to 224.51 million over the same period. Retail investors accounted for roughly one-third of NSE cash market turnover in FY26.
The Indian liquidity advantage
The comparison with BSE shows why liquidity matters more than the number of listings. As of 30 June 2026, BSE had 5,713 listed entities against NSE's 3,005. Yet the market capitalisation on both exchanges was almost the same at about Rs 474 trillion because many large companies trade on both.
Trading activity was very different. In the June 2026 quarter, NSE recorded cash market turnover of Rs 81.57 trillion against BSE's Rs 5.97 trillion. NSE also earned higher total income and profit. Once an exchange develops deeper liquidity, investors and brokers send more orders to it. That brings in still more liquidity and makes the lead difficult to reverse.
India’s long term market performance
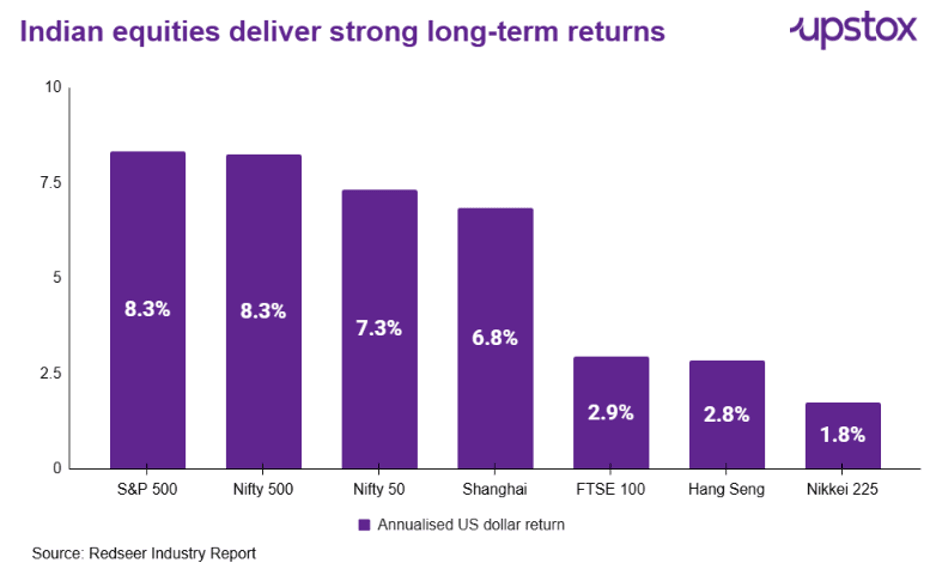
Indian equities have delivered strong dollar returns over the past 30 years. The Nifty 500 returned 8.26% annually, nearly matching the S&P 500 at 8.33%, while the Nifty 50 returned 7.32%. This performance has helped deepen investor participation and strengthened the long-term opportunity for exchanges such as NSE.
The valuation asks investors to look past FY26
The offer values NSE at 40.8-42.9 times FY26 diluted earnings. On FY28 estimates cited by Reuters, the multiple is 35-38 times, against 23-31 times for major global peers. This is a clear premium, ranging from roughly 13% against the top of the peer range to about 65% against the bottom.
| Offer | Price band | Issue size | Implied value | Use of proceeds |
|---|---|---|---|---|
| 126.44 million shares | Rs 1,700-1,785 | Rs 21,495-22,568 crore | Rs 4.21-4.42 lakh crore | Entirely OFS |
Source: NSE RHP; Note: At the upper band, the company would be valued at about US$46 billion.
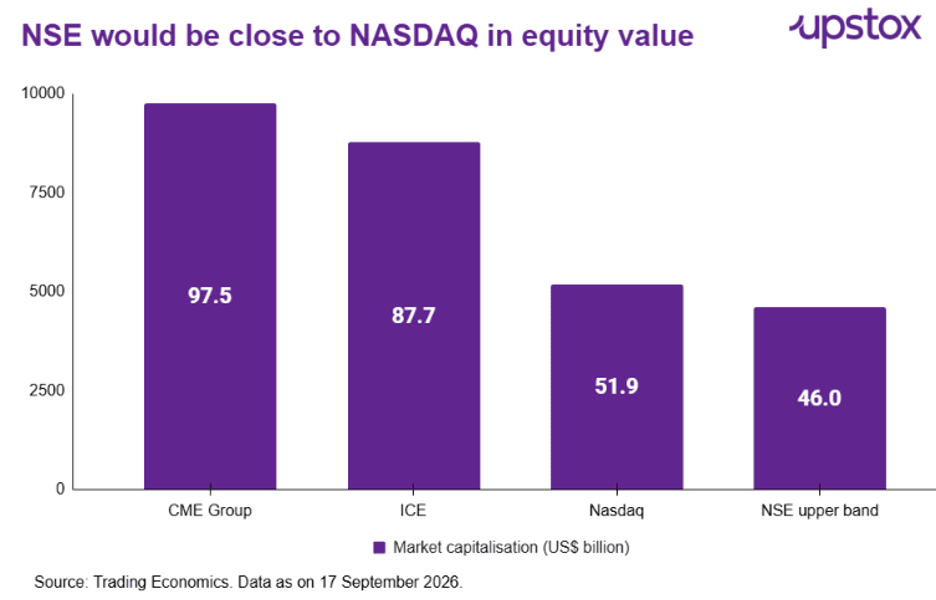
The Nasdaq comparison shows why investors may accept part of that premium. NSE's implied equity value of about US$46 billion is close to Nasdaq's US$49.9 billion. NSE has only about one-quarter of Nasdaq's income, but around two-thirds of its implied profit after tax. NSE's 55.05% profit margin narrows the profit gap created by its smaller revenue base.
FY26 also shows the risk in this valuation. Revenue from operations fell 3.1% and profit fell 15.5% after derivatives activity slowed following rule changes. Options premium ADTV declined to Rs 57,662 crore from Rs 62,449 crore, and futures ADTV also fell. In a high-margin business, a moderate fall in volumes can lead to a larger fall in profit.
The offer price equals 35-38 times FY28 earnings. Global peers including Nasdaq, CME, Deutsche Borse, HKEX and LSEG trade at 23-31 times. NSE therefore commands a premium. Its trailing multiple is below BSE's 66.67 times FY26 earnings as of 12 June 2026, but BSE is smaller and has a different business mix.
Beyond derivatives, where growth could come from
NSE does not need one business to replace options. It can build several recurring revenue streams around its existing liquidity network. Investors should separate businesses that already earn revenue from those that are still future opportunities.
| Area | Existing position | Potential scaling path |
|---|---|---|
| Cash equities | 93.0% market share; Rs 1,555 crore FY26 transaction revenue | Industry turnover projected at Rs 473-507 trillion by FY30, a 14-16% CAGR |
| Data and connectivity | 1,680 colocation racks; about Rs 1,804 crore from racks, connectivity and data feeds | NSE aims to add 2,000 racks; industry external racks projected to grow 20-25% CAGR |
| Indices and passive products | Rs 152 crore licensing revenue; Rs 8.14 trillion domestic passive AUM tracked Nifty indices | Indian index fund and ETF AUM projected at Rs 23-27 trillion by March 2030 |
| Fixed income | 85.7% corporate bond settlement share; Rs 15.55 trillion debt raised on NSE | Corporate bond turnover projected at Rs 35-41 trillion by FY30 |
| Listings and clearing | 219 IPO listings in FY26; established clearing subsidiaries | Listing revenue projected at 15-20% CAGR and clearing revenue at 15-17% CAGR |
| GIFT City and new assets | NSEIX held 99.8% of GIFT equity derivatives contracts in FY26 | More international, commodity, energy and India-linked products can widen the addressable market |
Source: NSE Red Herring Prospectus and Redseer Industry Report
Cash equities are the nearest opportunity because NSE already has the liquidity and users. Data, indices and connectivity can add steadier fees that depend less on daily trading volumes. Fixed income and GIFT City offer a larger future market, but both need more institutional participation and supportive regulation.
The mutual fund platform shows the gap between market size and current revenue. India's mutual fund AUM reached Rs 73.73 trillion in March 2026, but NSE earned only Rs 18 crore from mutual fund transaction charges in FY26. More participation can increase volumes, but revenue will still depend on pricing, competition and regulation.
What global investors should watch
- Options volumes after the expiry, contract size and risk-control changes introduced by SEBI.
- Growth in cash market transaction revenue relative to the wider industry's projected turnover growth.
- Whether index, data, connectivity and colocation revenue grows faster than transaction revenue.
- Progress in fixed income, GIFT City, commodities and energy products, with separate attention to volumes and revenue per trade.
- Technology resilience and regulatory outcomes, because an exchange is both a commercial company and a public market utility.
In Conclusion
NSE already operates at global scale and holds a dominant position in India. It is also highly profitable. However, it is less diversified than ICE, Nasdaq or LSEG. That is both the opportunity and the risk. The offer price assumes that India's investor base and capital markets will keep growing. It also assumes that NSE can earn more from data, indices, connectivity and clearing. NSE's dominance is clear. The key question is how much of it can become diversified earnings as derivatives activity normalises.
About The Author
Next Story