Upstox Originals
Is mining the weak link in India's industrial cycle?

6 min read | Updated on September 18, 2026, 14:26 IST


SUMMARY
When factories are producing more and power consumption is rising, shouldn't mining be booming too? Yet the latest IIP data tells a different story. Manufacturing and electricity output expanded strongly, while mining declined. Rather than signalling a supply shortfall, the reality is more nuanced. Read on to find out.
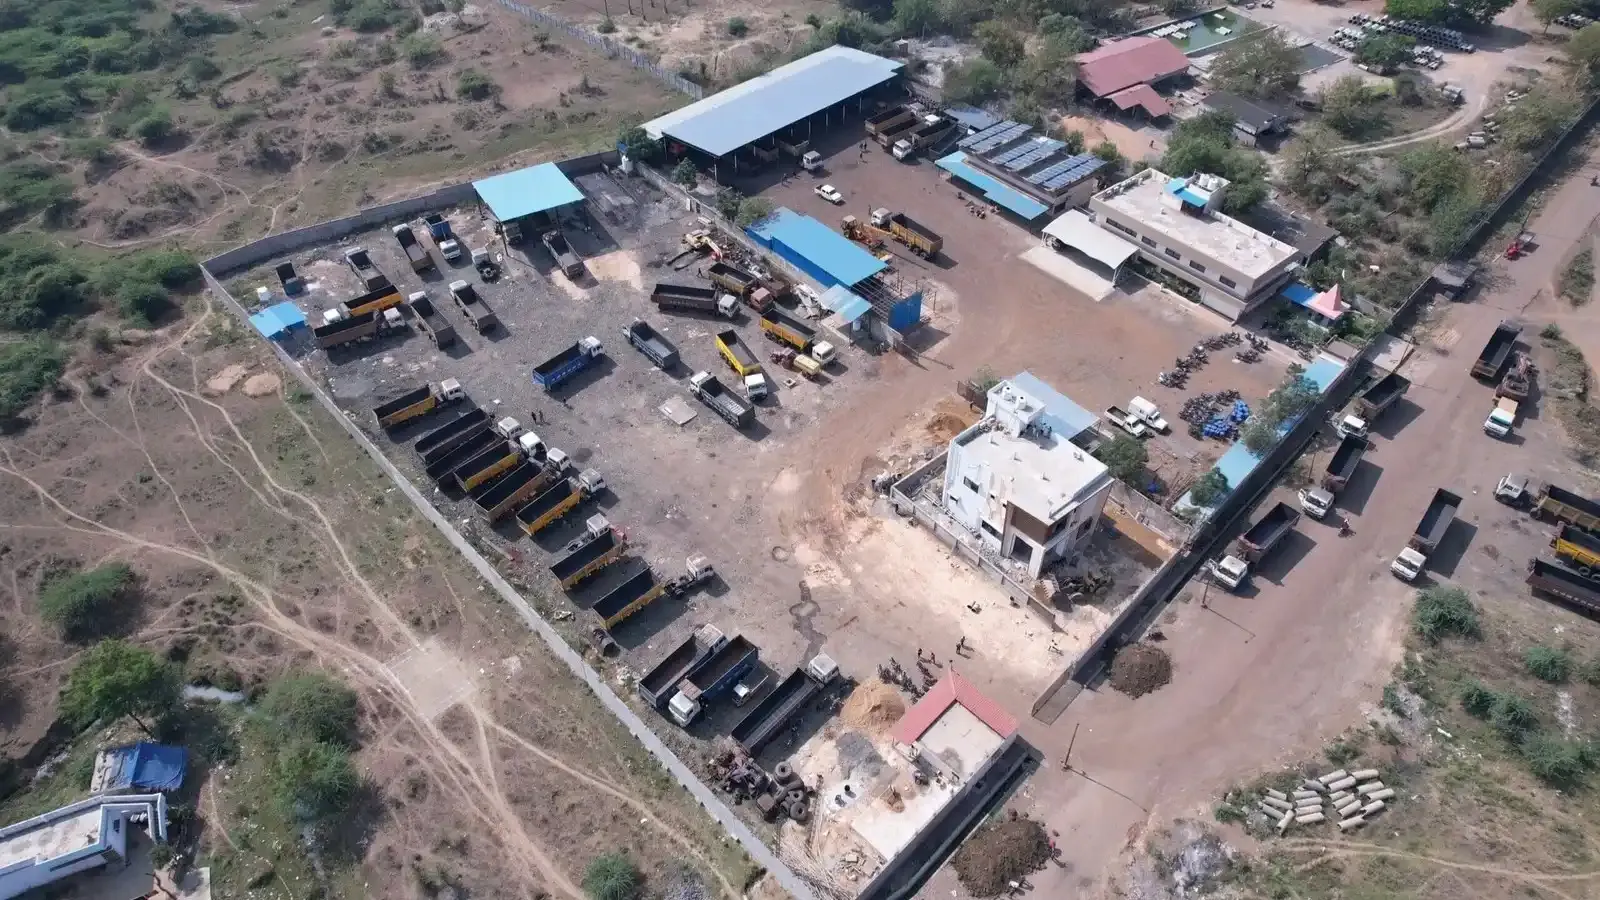
Between April and July, 52 million tonnes more coal left the mines than was mined. | Image: Shutterstock
If India's factories are making more goods and its power plants are generating more electricity, shouldn't its mines be digging more too? July's industrial data suggest otherwise. That raises a question for anyone tracking the economy: is mining becoming a bottleneck, or is the headline missing what is really happening?
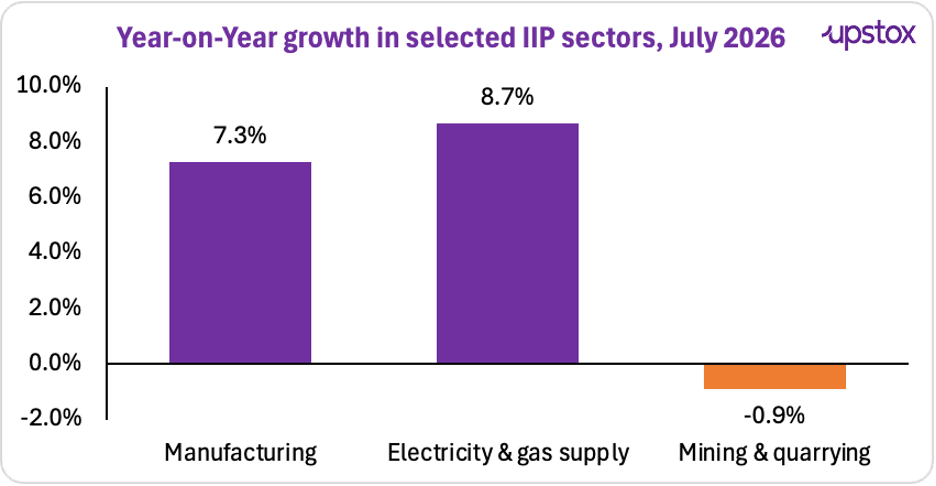
The latest Index of Industrial Production (IIP), which tracks the output of India's factories, mines and power plants, shows the gap. In July 2026, manufacturing grew 7.3% and electricity and gas supply grew 8.7%. Mining fell 0.9%. Nor was it a one-off: mining has shrunk in six of the seven months of 2026.
Source: MoSPI
The answer lies inside the mining index. Coal stocks, ageing oilfields, rising iron ore output and a new data series are pulling it in different directions. Here is what each tells us about India's industrial cycle.
Where did the coal come from?
From a pile that was already above ground.
2025 was a quiet year for electricity. The monsoon came early and stayed, demand barely grew, and coal-fired generation actually fell. Coal India kept digging anyway. By March this year, India was sitting on about 210 million tonnes of coal, close to three months of consumption, most of it stacked at the mines.
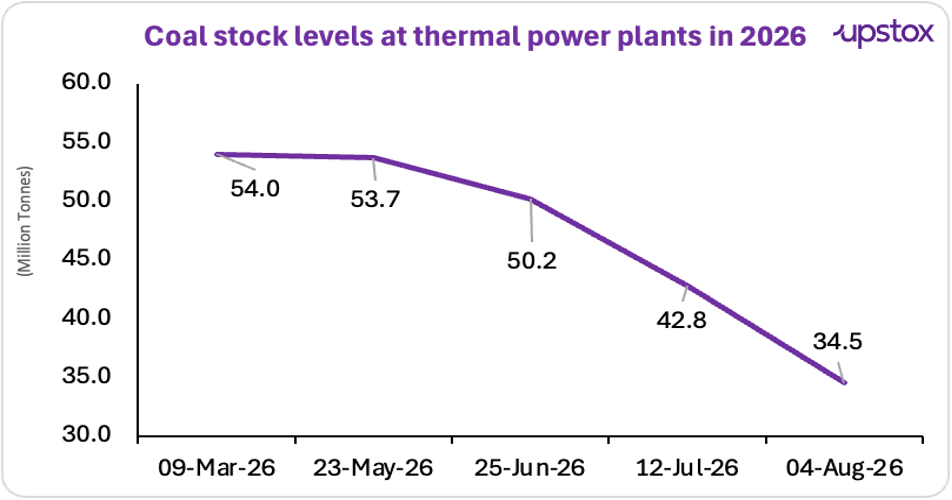
Then 2026 turned hot and dry, and the power plants started eating into that pile. In July, the mines dispatched 17% more coal than a year earlier but dug only 7.5% more. Between April and July, 52 million tonnes more coal left the mines than was mined. The national stock is down to about 148 million tonnes, and the coal sitting at power plants has fallen from 54 million tonnes in March to under 35 million.
Source: Ministry of Coal; Ministry of Power; CEA data via Argus Media
Imports did not fill the gap either; thermal coal imports are at a four-year low. The pantry did. And a pantry can only be emptied once. The buffer has months left, not years, and when it runs down the mines will have to dig faster than the plants burn. That is when the mining number turns.
Why is oil output falling in a growing economy?
The answer lies in what makes up the “fuel minerals” index. Coal is only one part of it; crude oil and natural gas matter too. They are falling for a reason that has nothing to do with demand: the fields are old.
Mumbai High, ONGC's biggest field, has been pumping since 1976. India's crude production has now fallen three years in a row, to about 28 million tonnes in FY26, and the petroleum ministry's own explanation to Parliament in August was "natural decline in mature and ageing oil and gas fields". Nearly 90% of the crude India refines is imported, so when the economy grows, the extra demand goes to the Gulf, not to ONGC.
Oil output falls in a boom and falls in a bust. The ₹84,084 crore offshore exploration scheme approved in July is the right response, and it will take years to show up in the numbers.
Is any part of mining booming?
Yes, loudly. Iron ore output jumped 29.5% in July. Steel, its main customer, grew 2.9%. That gap is not a mystery. Last year's base was weak after JSW Steel gave up a large Odisha mine. New merchant mines have opened since, and NMDC had its best July ever. Exports to China are up. And the miners are building inventory: NMDC dug 27% more ore between April and July than a year earlier and sold just 1% more. So the one piece of mining that is tied to Indian industry is not lagging the cycle. It is running ahead of it.
Then what actually dragged the number down?
A category most people have never heard of: non-metallic minerals. Mainly limestone, plus sand, gravel and building stone. It fell 12.5% in July and has fallen every month this financial year. Without it, the mining index would have risen about 3% instead of falling.
Now look downstream. Cement, which is made from limestone, grew 13.1%. A dry monsoon is good for quarrying, not bad. When the raw material falls 12% and the product made from it rises 13%, the likelier problem is the statistic, not the quarry.
There is a reason to suspect it. Sand, gravel and stone were added to the IIP only in June, when the index moved to a new base year, and their data come from state governments through a reporting chain that is a few months old. The revised July number arrives on September 28. Until then, this is a number to watch, not a number to believe.
So, is mining the weak link?
Not in the way the headline suggests.
| Part of the mining index | July 2026 | What is going on |
|---|---|---|
| Coal, oil and gas | -1.3% | Coal demand met from a record stockpile; oilfields ageing |
| Iron ore and other metals | +24.3% | New mines, exports, inventory building; running ahead of steel |
| Limestone, sand and stone | -12.5% | Contradicts cement at +13%; new data series, likely to be revised |
| Mining and quarrying | -0.9% | Net of the three above |
Source: MoSPI, IIP quick estimates for July 2026
Coal is tied to the cycle, but a record stockpile is standing between the two. Oil and gas are not tied to the cycle at all. Iron ore is running ahead of it. And the one category that produced the contraction is the newest, least-tested number in the series. One last caution: under the new base year, July 2025 was a strong month for mining, so July 2026 is being measured against a high bar.
Three things will settle it: the coal stockpile, at 148 million tonnes and falling; the August IIP on September 28, where the non-metallic figure is the one most likely to move; and the monsoon, which IMD expects to stay dry through September, meaning more coal burn.
What looks like a weak link is a pantry being emptied, oilfields that are half a century old, and a statistic that has not yet settled. The industrial cycle is intact. The mining index is simply not the place to read it.
About The Author
Next Story