Upstox Originals
NSE IPO: The exchange that runs India’s markets

10 min read | Updated on June 19, 2026, 18:19 IST


SUMMARY
NSE didn’t just enter India’s stock market—it rewired it, shifting trading from broker-driven floors to a transparent, system-led model. While BSE is finally finding momentum in pockets like index options, NSE’s edge still comes from the sheer depth of its ecosystem. What makes it interesting now is not dominance, but what could disturb it—new segments like commodities, rising competition, and a business model still heavily tied to trading volumes.
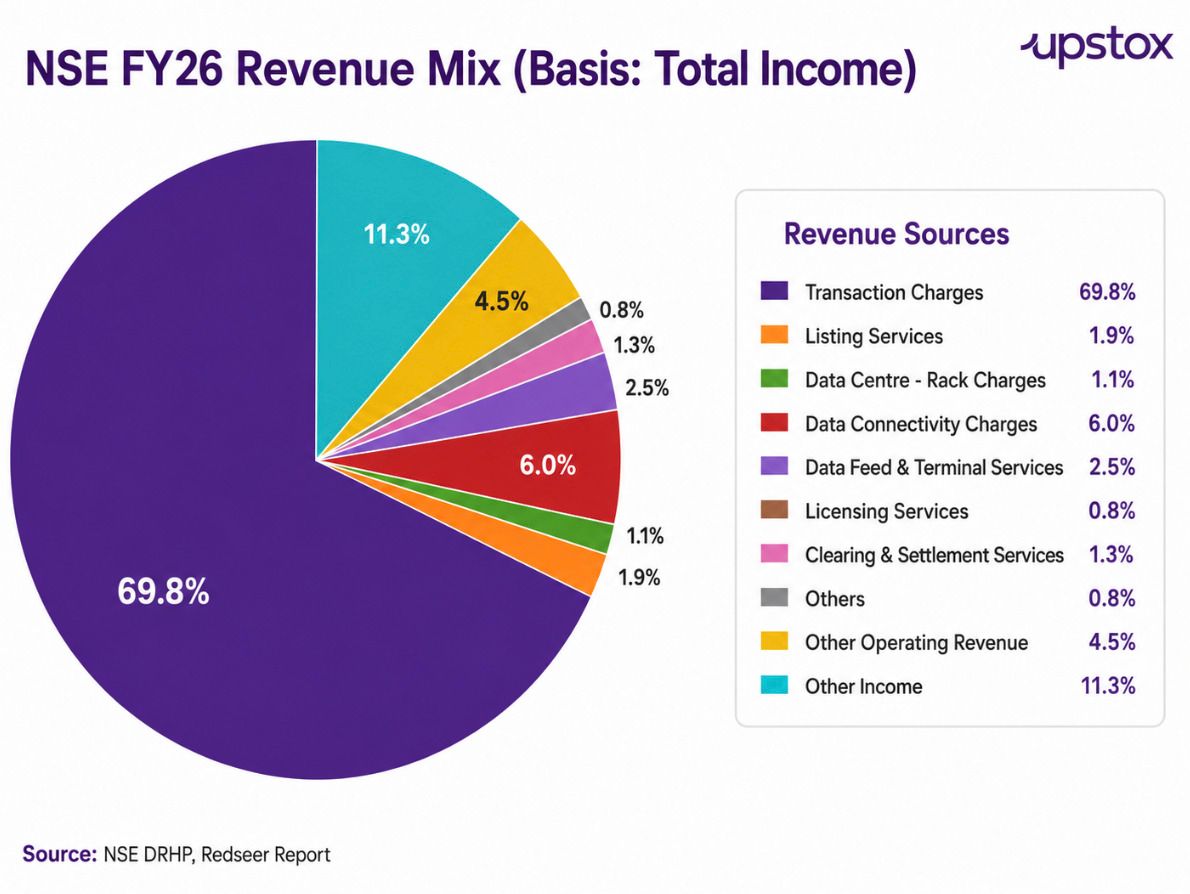
In FY26, NSE’s total income stood at ₹18,713 crore, with nearly 70% coming from transaction charges. | Image: Shutterstock
Every time an investor buys a stock, sells an option, or places a trade in India, there is a high chance the transaction passes through the National Stock Exchange of India (“NSE”).
NSE entered the market in 1992, where BSE already had a history, broker relationships, and institutional trust. But NSE transformed the market with screen-based trading (NEAT - NSE's Electronic Automated Trading), nationwide access, transparent order matching, and scalable clearing infrastructure. That shift from “broker-led ring” to “system-led market” helped NSE build trust, liquidity, and eventually market leadership.
Liquidity attracted participants, higher participation improved price discovery, and stronger price discovery further reinforced NSE’s position within India’s trading ecosystem. Over time, NSE has moved beyond being only a domestic exchange franchise.
Its scale is now comparable with leading global exchanges, particularly in derivatives contracts traded and cash equity trade volumes. By FY26, NSE had become the primary exchange for most major trading segments in India, with 92.99% share in the cash market, near-total share in single-stock futures and options, 98.87% share in index futures, and almost complete share in currency and interest-rate futures.
The main exception remains commodities, where NSE’s share is still below 1%. This segment represents an area of potential diversification. The exchange has begun expanding its commodity offering through new product launches, but its ability to gain meaningful share will depend on liquidity migration (better volumes for commodity contracts), participant adoption, product depth, and response from existing commodity exchanges.
| Asset class | NSE market share (% of turnover), FY26 |
|---|---|
| Cash market | 92.99% |
| Single stock options (Premium) | ~100.00% |
| Single stock futures | ~100.00% |
| Equity index options (Premium) | 72.11% |
| Equity index futures | 98.87% |
| Corporate bonds | 85.65% |
| Currency futures | 99.48% |
| Currency options (Premium) | ~100.00% |
| Interest rate futures | ~100.00% |
| Electricity futures | 71.38% |
| Commodity futures | <1.00% |
| Commodity options (Premium) | <1.00% |
Source: NSE DRHP, Redseer Report
What is its business model?
NSE’s revenue model is heavily transaction-led. In FY26, total income (includes revenue from operations as well as other income) stood at ₹18,713 crore, with nearly 70% coming from transaction charges. Since transaction charges depend on trading volumes, income can remain sensitive to market cycles, volatility, participation levels, and regulatory changes affecting trading behaviour.
The remaining income comes from listing-related fees, data and connectivity services, data centre rack charges, index licensing and data subscriptions, clearing & settlement services, and investment income.
NSE vs BSE: Scale leader vs high growth challenger
NSE remains the dominant exchange franchise in India by scale, liquidity, and market share.
However, BSE relaunched index derivatives products in 2023. This helped BSE gain meaningful share in index options. The growth has translated into a sharp improvement in BSE’s financial performance, with revenue from operations and operating EBITDA growing at a much faster CAGR over FY24–26 compared with NSE.
| NSE | NSE | BSE | BSE | ||
|---|---|---|---|---|---|
| Particulars | Unit | FY26 | CAGR (FY24-26) | FY26 | CAGR (FY24-26) |
| Revenue from operations | ₹ crore | 16,601.3 | 6.0% | 4,833.9 | 87.8% |
| EBITDA | ₹ crore | 11,097.9 | 6.0% | 3,078.7 | 177.8% |
| EBITDA Margin | % | 66.8 | 64.0 | ||
| Profit for the year / PAT | ₹ crore | 10,302.0 | 11.4% | 2,487.2 | 79.5% |
| PAT Margin | % | 50.9% | 48.0% | ||
| RoE | % | 32.6% | 43.5% | ||
| Segment market share | |||||
| Cash | % | 93.0% | 7.0% | ||
| Index options — premium | % | 72% | 28% | ||
| Futures | % | 99.8% | 0.2% |
Source: NSE DRHP, Redseer Report
That said, BSE’s growth is coming off a much smaller base. The market has, however, rewarded BSE’s faster growth trajectory, resulting in higher valuation multiples. I
| Valuation | PE ratio based on FY26 earnings |
|---|---|
| NSE | 50* |
| BSE | 66 |
| MCX | 53 |
Source: Screener.in, Moneycontrol. *NSE valuations is considered as INR 5 Lakh crore based on multiple news reports on its potential IPO valuations
Comparison with Global Peers: Smaller in Scale, Stronger in Margins
Compared with global listed exchange groups, NSE remains smaller in absolute revenue scale. However, its FY26 metrics show a high-margin, capital-efficient operating model, supported by India’s volume-led trading ecosystem and faster capital-market growth.
| Exchange Data for FY26 | Country / Region | Adjusted EBITDA Margin | RoNW | 4-Year Income CAGR (FY22-26) |
|---|---|---|---|---|
| NSE | India | 75.4% | 32.98% | 20.5% |
| BSE | India | 65.2% | 45.00% | 56.2% |
| MCX | India | 71.5% | 46.75% | 48.8% |
| HKEX | Hong Kong | 73.1% | 31.70% | 11.4% |
| SGX | Singapore | 60.3% | 31.15% | 8.0% |
| LSEG | United Kingdom | 46.8% | 5.84% | 9.6% |
| Nasdaq | United States | 37.1% | 15.26% | 8.9% |
Source: NSE RHP, Redseer. RoNW stands for returns on net worth.
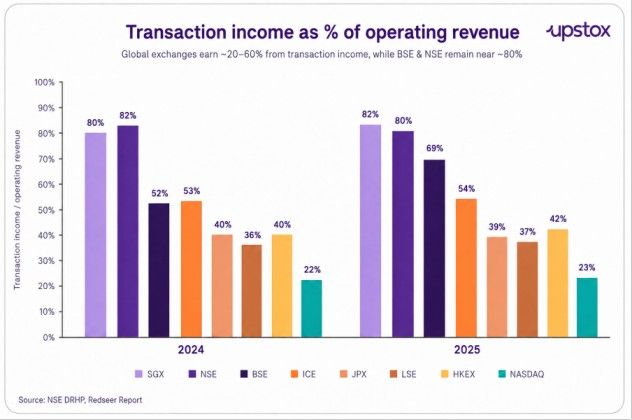
The key difference between Indian exchanges and global peers is that of business model and revenue stability. Indian exchanges remain more transaction-led, with a large share of operating revenue linked to trading activity. Global peers have more diversified and stable income, with stronger annuity-like income streams from data, technology, information services, indices, and post-trade infrastructure.
Who owns the NSE?
NSE is owned by 65% public shareholders, while 35% is owned by trading members (brokers). In public shareholding, NSE has diversified shareholding, which includes FIIs, PE Funds, banks, insurance, DIIs and family offices. Here are top 20 shareholders:
| Shareholder | Pre-offer equity shareholding (%) |
|---|---|
| Life Insurance Corporation of India | 10.72% |
| Aranda Investments (Mauritius) Pte Ltd | 4.54% |
| Stock Holding Corporation of India Limited | 4.44% |
| SBI Capital Markets Limited | 4.33% |
| Mahagony Limited | 3.73% |
| State Bank of India | 3.23% |
| PI Opportunities Fund I | 2.35% |
| Crown Capital Limited | 2.07% |
| DVI Fund (Mauritius) Limited | 1.83% |
| TIMF Holdings | 1.75% |
| General Insurance Corporation of India | 1.64% |
| Canada Pension Plan Investment Board | 1.60% |
| Radhakishan Shivkishan Damani | 1.58% |
| National Insurance Company Limited | 1.42% |
| The New India Assurance Company Ltd. | 1.42% |
| The Oriental Insurance Company Limited | 1.42% |
| TA Asia Pacific Acquisitions Limited | 1.40% |
| MS Strategic (Mauritius) Limited | 1.20% |
| 2726247 Ontario Inc. | 1.09% |
| Rimco (Mauritius) Limited | 1.00% |
Source: RHP
The IPO
NSE's IPO size is estimated to be of ₹29,780 crore to ₹30,000 crore, which is 100% an Offer for Sale (OFS), representing a ~6% stake dilution. Because it is entirely an OFS, NSE will not receive any fresh capital from the public issue; all proceeds go directly to the participating investors. IPO is expected to come in late FY27 as per the management interview.
The selling shareholders include State Bank of India, Morgan Stanley, Canada Pension Plan Investment Board, Temasek, Bank of Baroda, Stock Holding Corporation of India, General Insurance Corporation of India, The New India Assurance Company, National Insurance Company, and United India Insurance Company.
Key risk factors
-
High dependence on transaction volumes: A large part of exchange revenue is linked to trading activity. Any decline in market volumes due to weak sentiment, lower volatility, regulatory changes, or reduced retail participation can impact revenue growth.
-
Regulatory risk: Exchanges operate in a tightly regulated environment. Changes in transaction charges, margin norms, derivatives rules, settlement timelines, or investor-protection regulations can affect volumes and profitability. NSE has been historically subject to SEBI’s investigations multiple times for non-compiances
-
Concentration in key segments: NSE’s dominance is strongest in equities and derivatives, but this also creates dependence on a few high-volume products. Any shift in participant behaviour or product-level regulation can affect earnings.
-
Competition risk: BSE’s revival in index options shows that market share can shift when competing exchanges launch relevant products with liquidity incentives. Sustained competition may impact pricing power and margins.
-
Technology and operational risk: Exchanges are critical market infrastructure. Any system outage, cybersecurity breach, latency issue, or settlement disruption can affect trust, invite regulatory scrutiny, and damage reputation.
-
Revenue mix risk: Compared with global peers, Indian exchanges remain more transaction-led and less diversified into annuity-like revenue streams such as data, indices, technology, and post-trade services. This makes earnings more sensitive to market cycles.
-
Execution risk in new products: Growth areas such as commodities, GIFT IFSC, data services, colocation, and new derivatives products require liquidity build-up. Success depends on participant adoption, product design, and competitive response.
Industry backdrop: Financialisation is expanding the exchange opportunity
India’s exchange industry is being supported by a structural shift in household savings and financial participation. Rising incomes are moving more households into middle and higher-income categories, expanding the pool of potential investors over time.
At the same time, financial access has improved meaningfully, with bank account penetration at ~89% and unique stock investor penetration still only at 13.45% in FY26, indicating a long runway for market participation.
| Financial product | Penetration in India (FY26 (% of population) |
|---|---|
| Bank account | ~89.00% |
| Debit card | 40–48% |
| Mobile banking | <26.51% |
| Unique stock investors | 13.45% |
| Internet banking | <8.32% |
| Credit card | 4–8% |
Source: Redseer Research and Analysis
Despite the growth in demat accounts, SIPs, and equity investing, India remains relatively underpenetrated compared with developed markets. Financial assets account for 46.74% of household savings in India, lower than Japan at 63.57% and the US at 68.95%. This shows that a large part of household wealth is still held in physical assets such as real estate and gold.
| Country | Physical assets (% of household savings. | (Financial assets (% of household savings) |
|---|---|---|
| India | 53.26% | 46.74% |
| Brazil | 51.00% | 49.00% |
| Japan | 36.43% | 63.57% |
| US | 31.15% | 68.95% |
Source: Redseer Research and Analysis
For exchanges, this creates a long-term growth opportunity. As more savings shift from physical assets to financial products, participation in equities, mutual funds, ETFs, derivatives, bonds, and other market-linked instruments can deepen. This should support higher trading activity, more listings, greater data usage, and broader demand for market infrastructure services.
Before you go
Exchange businesses benefit from a simple flywheel: more participants drive higher volumes, better liquidity, and stronger price discovery. As volumes grow, fixed costs are spread over a larger base, improving operating leverage. Higher activity also creates more data, enabling new products, indices, analytics, and risk tools.
About The Author
Next Story

