Upstox Originals
Indian large caps: More pain or opportunity around the corner?

6 min read | Updated on April 15, 2026, 19:01 IST


SUMMARY
In times of market crashes, investors typically look for safe spaces to park their funds. Large caps are supposed to be one such “safe space.” But are they? Their recent performance shows that they have sharply underperformed their mid- and small-cap peers. Read on to know the potential reasons for the same and what should investors do at such times.

So far in 2026, lage caps have underperformed their mid and small cap peers. | Image source: Shutterstock
After an eventful 2025, 2026 continues to be a rollercoaster year for the markets. Just as the aftereffects of tariffs were fading, the West Asia crisis has exacerbated market weakness. So far this year, the Indian markets have declined ~8% already (as on April 15).
In times like this, conventional market wisdom tells one to find safety in quality. Using that, the common advice is to look at large caps. These are well-established, well-researched companies with a storied record and as such, should be able to provide a temporary shelter.
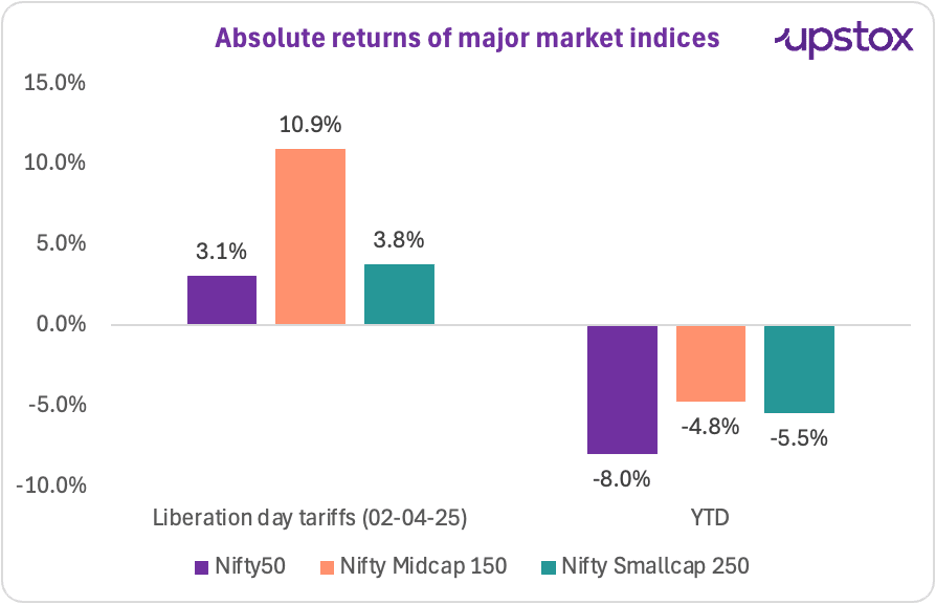
But has that been the case? Let’s take a look at the absolute returns across major indices since April 2, 2025 (when President Trump first announced his “Liberation Day” tariffs) and year-to-date returns.
As seen in the chart below, the Nifty50, which represents India’s 50 largest companies, has actually underperformed its mid- and small-cap peers. As seen below
Since April 2, 2025, the Nifty 50 has significantly underperformed its mid-cap peers. Its performance has broadly been in line with the small-cap peers. YTD returns present an even more disappointing picture, with the Nifty50 actually underperforming both its peers.
Think about this – India’s 50 best companies that should have provided you a safe haven have actually not been able to live up to that reputation. So, what has gone wrong?
Source: Investing.in; *Note: Data as of 10 April 2026
Let’s look at the composition of each of these indices to understand this better. As seen in the tables below, the Nifty50 is predominantly composed of Financials, Oil & Gas, and IT – and here is something all three have in common – they have all been in the eye of the storm lately.
Sectoral composition of the indices
| Sector | Nifty50 | Nifty Midcap150 | Nifty Smallcap150 |
|---|---|---|---|
| Financial Services | 35.5 | 27.1 | 22.7 |
| O&G | 11.0 | 2.6 | 2.8 |
| IT | 9.4 | 5.0 | 4.2 |
| Automotive | 6.6 | 7.2 | 8.1 |
| FMCG | 6.0 | 4.4 | 3.6 |
| Healthcare | 4.7 | 10.2 | 13.6 |
| Consumer Services | 2.3 | 5.5 | 4.1 |
| Capital Goods | 1.4 | 13.4 | 12.1 |
| Chemicals | NA* | 4.0 | 7.4 |
| Others | 23.2 | 20.7 | 21.4 |
Source: NSE; Data as of 30 March 2026; *Note - Nifty50 does not have a specific sectoral allocation for Chemicals
As seen in the table below, each of these sectors that are major constituents of the Nifty50 – has been one of the worst performers. Consequently, the Nifty50 has taken its toll on the Nifty50 as well.
YTD performance of select sectoral indices
| Sector | YTD |
|---|---|
| Nifty Financial Services | -7.2% |
| Nifty IT | -17.4% |
| Nifty O&G | -9.3% |
| Nifty Automotive | -9.1% |
| BSE Capital Goods | 4.1% |
| Nifty Healthcare | -3.0% |
Source: Screener.in; Data as of 09 April 2026
The point here is that large-cap companies provide a certain element of safety, but understanding the nature and cyclicality of each of its constituents is critical to make investment decisions.
Sectoral mix is just as critical as the stock and size composition. Small and midcap indices definitely have riskier companies, but in the current market (down)cycle, the sectors that constitute the larger portion there have been relatively resilient.
Take healthcare, for example – it has a double-digit presence in the mid and smallcap indices, while it is less than 5% in the large-cap Nifty50 index. In both the crises mentioned above – tariffs and the recent West Asian war – healthcare has been relatively resilient as it is not directly impacted.
Capital goods are another example. Infrastructure has been a huge priority for this government. Besides that, a lot of capital goods companies have also benefited since they are into defence manufacturing. Both of these factors have augured well for this sector.
Consequently, both of these sectors have fared better than their peers and managed to bolster performance.
Even active mutual funds have not been immune to this. Mid and small-cap funds have not only generated superior long-term CAGR returns, but have actually been more resilient to short-term volatility.
Active mutual fund performance by size
| 1 Month | 3 Months | 1 Year | 3 Years | 5 Years | 10 Years | |
|---|---|---|---|---|---|---|
| Large Cap | (6.0) | (11.6) | 1.6 | 12.5 | 11.2 | 12.3 |
| Large & MidCap | (5.7) | (11.0) | 3.2 | 15.0 | 13.7 | 14.2 |
| Flexi Cap | (5.2) | (10.9) | 2.2 | 13.5 | 11.8 | 13.1 |
| Mid Cap | (4.9) | (10.2) | 6.5 | 19.1 | 16.4 | 15.8 |
| Small Cap | (3.1) | (10.2) | 2.1 | 17.0 | 16.9 | 16.0 |
Source: Value Research; Data as of 08 April 2026
Second, the rise of passive investing (via index funds / ETFs), has also led to an influx of new investors in the Nifty50. It is not going to be easy to see that their supposedly safer investment actually has been underperforming its riskier counterparts.
At this point in the cycle, they would not be wrong. But here is what matters - despite multiple crises, the Nifty50’s long-term CAGR (excluding dividends) still remains resolutely between the 13-14% range. So, here is a parting thought. At this stage in the cycle, the decline in large caps may represent either more pain ahead or an interesting entry point — and the answer depends heavily on where you think we are in the cycle.
About The Author
Next Story
