Upstox Originals
SIPs gave negative returns in FY26; what lies ahead for investors?

6 min read | Updated on April 25, 2026, 10:38 IST


SUMMARY
If you’ve been investing through SIPs, the past few years haven’t felt great due to rising volatility. Short-term returns have been largely negative across equity funds, and stoppages are rising. And yet, SIP flows continue to hit record highs, with monthly contributions crossing ₹32,000 crore. But, with the outlook still hazy, how long will retail investors persist?

For the year ended March 2026, out of 556 mutual fund schemes reviewed, 486 generated negative returns.
As market volatility picked up, foreign investors exited at a record pace. Yet, the Indian market found its “shock absorber” in everyday domestic investors.
As the table below showcases, monthly contributions crossed ₹0.32 lakh crore for the first time in March; up 7.5% month-on-month and 23.8% year-on-year. Active SIP accounts also rose 3% to 9.72 crore (from 9.44 crore).
| Contribution Metric | Jan-26 | Feb-26 | Mar-26 |
|---|---|---|---|
| No. of Contributing SIP Accounts (crore) | 9.92 | 9.44 | 9.72 |
| SIP Monthly Contribution (₹ crore) | 31,002 | 29,845 | 32,087 |
| SIP Assets (% of Industry AUM) | 20.2 | 20.3 | 20.5 |
Source: AMFI, CRISIL Intelligence
So, what seems to be the challenge?
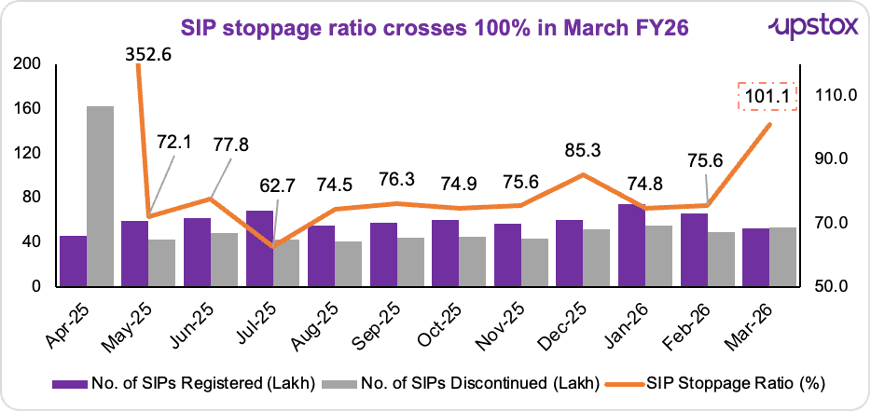
While inflows remain strong, a growing number of investors are turning cautious, too. SIP stoppages have picked up, reflecting the discomfort of those very same returns. What does it signal? Simply this: more SIPs are being stopped than started.
Well, we’ve seen this before. During events like Liberation Day, the ratio had spiked sharply, even crossing 352%. And now, it has edged past 100% again.
Source: The Indian Express
Short-term returns under pressure across categories
Across categories, SIP returns remained firmly negative over shorter time horizons. As shown in the chart below, the most popular small and flexi-cap categories have given an average negative return of ~15% and ~14%, respectively, over the last year.
Similarly, the average return from large and multi-cap schemes were down 14% and 13% respectively over one year, and it dipped ~5% for each of them in 2 years.

Source: Hindu Business Line; returns as on March 25, 2026
At the scheme level, the picture was even sharper.
An analysis by ETMutualFunds for the financial year from April 1, 2025 to March 31, 2026 (as of March 23, 2026) out of 556 schemes reviewed, 486 generated negative returns, with technology and small-cap funds emerging as the worst performers.
- Technology-focused funds: The worst-performing funds in this category saw absolute SIP losses of 35% to 47%. Other tech-oriented schemes followed closely with declines ranging between 29% and 32%.
- Small-Cap category: This popular segment also faced a broad pullback. Leading funds in this space recorded negative absolute returns of 19% to 21% in FY26.
While the first instinct may be to blame fund managers, the reality is that most of these funds have seen a huge spike in inflows, and given limited investment options, fund managers have had limited picks. As such, they have had to invest even at heightened valuations, leading to below average returns.
What does this mean for the markets?
Despite heightened volatility, domestic investors have remained resilient and stuck with their SIP investments. While that trend has sustained so far, the key question that remains is - how long will domestic investors keep tolerating below-average returns?
Domestic markets are expected to be under pressure as global volatility shows limited signs of abatement. One can argue that domestic investors did not flinch when the Russia-Ukraine or Israel-Palestine war started and even persisted when President Trump imposed tariffs. True. But the fact is, till then returns and overall market sentiment were both positive.
Market sentiment currently is jittery, and the key question is - returns don't bounce back, how long can retail investors sustain?
Does this mean one should panic and stop SIPs?
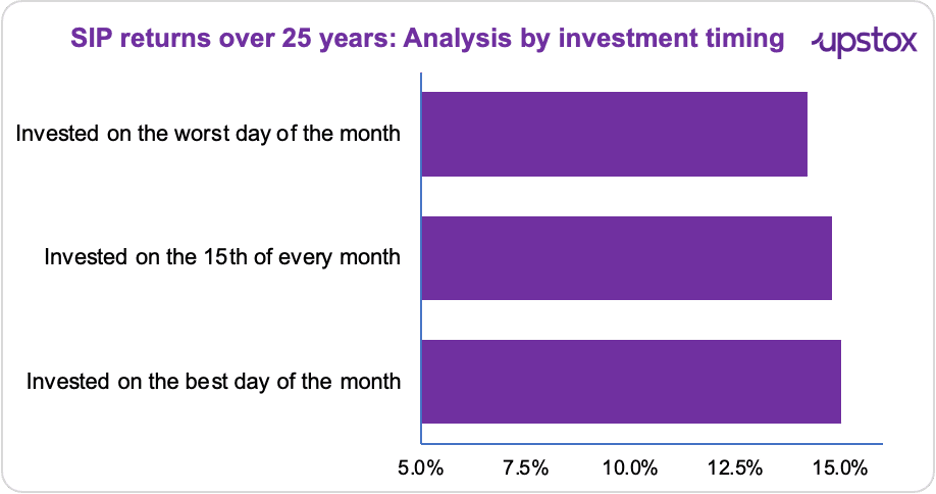
Short-term returns can look disappointing, even sharply negative. But SIPs aren’t designed for one-to three-year outcomes. So what do they look like over the long term? A 25-year analysis of SIP returns (Sept 1996 to Dec 2023) shows how this plays out. For three different scenarios, the returns looked like this:
-
Investing on the best day of every month: ~15.0% returns
-
Investing on the 15th of every month: ~14.8% returns
-
Investing on the worst day of every month: ~14.2% returns
Even if you got the timing wrong every single month, the long-term outcome wouldn’t look very different.
That’s because SIPs work on consistency. Over time, regular investing helps average out market ups and downs, something short-term returns don’t fully capture.
Source: Whiteoak Capital. SIP Returns are calculated for the period Sept-96 to Dec-23
That said, this is little comfort to an investor who has seen their returns consistently contract.
So, what could you do?
Diversification can change the experience. In FY26, while domestic equity SIPs were under pressure, SIPs in some international funds held up relatively better. These funds invest in overseas markets and are easily accessible through SIPs as well.
In volatile phases, or when domestic markets are under pressure, international SIPs can sometimes look better in the short term. But since this is closely linked to currency, it’s also something that can change depending on how the rupee moves.
For instance, in April 2026, the rupee moved in the 92.3–94 range against the dollar after weakening in late March. This is an area where a measured and cautious approach may be more appropriate. So international exposure can be kept as a small part of the portfolio.
| Fund | FY26 returns on SIP investments |
|---|---|
| Nippon India Taiwan Equity | 164.0% |
| Edelweiss Greater China Equity off-shore Fund | 38.9% |
| HSBC Asia Pacific (Ex Japan) DYF | 38.8% |
| ICICI Prudential US Bluechip Equity Fund | 11.1% |
Source: ET Mutual Funds Analysis *Data as on 23 March, 2026
Systematic Transfer Plan (STP) is another approach. It simply means gradually moving money from equity to debt or liquid funds, instead of exiting all at once. So a sharp fall can end up affecting only part of the portfolio, not all of it. Which, in a way, comes back to this: the experience isn’t just about how long you stay invested, but also how the exit unfolds.
Before you go.
During volatile phases, especially when headlines turn negative, the instinct to pull money out can get stronger. Markets can fall quickly, and decisions in such moments often end up being driven by timing rather than a broader plan.
But as the long-term SIP data suggests, outcomes over time haven’t differed as much across different entry points; highlighting how timing, while important in the moment, doesn’t always shape long-term results in a meaningful way.
About The Author
Next Story
