Upstox Originals
Could Indian equity markets turn a corner from here?

7 min read | Updated on April 17, 2026, 19:20 IST


SUMMARY
A combination of geopolitical tensions, a sharp crude oil spike, and sustained FII outflows has pushed the Nifty50 down roughly 15% from its recent peak (before the recent reversal). Historical data across market crises shows that markets tend to bottom before a crisis actually resolves. Put it another way, has all the uncertainty been ‘priced in?’

Despite the ongoing crisis, have the Indian markets seen the worst? | Image source: Shutterstock
Since 1990, the Sensex has risen from ~1,000 points to over 80,000 - compounding wealth through the Gulf War, the Harshad Mehta scam, Kargil, the Lehman collapse, COVID-19, and a host of other disruptions. Each of these events, at the time, produced genuine uncertainty and sharp market declines.
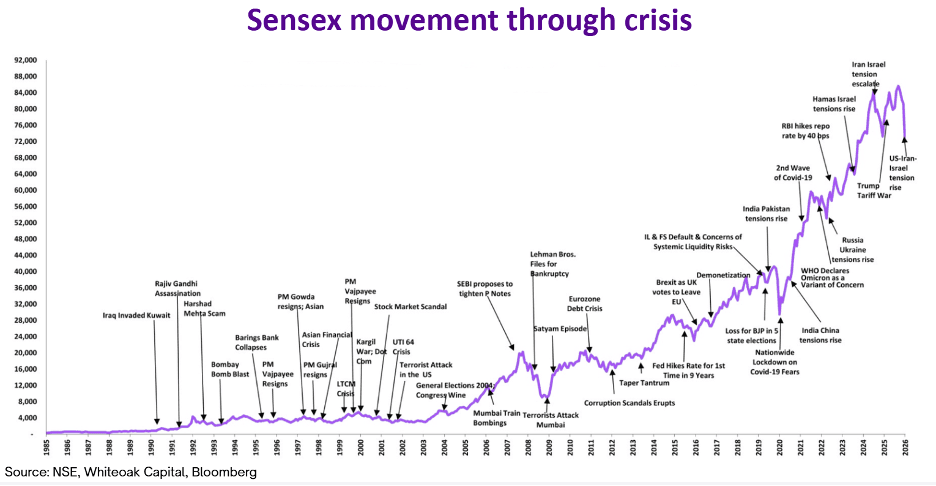
Recently, the US-Iran conflict that began in late February 2026, accompanied by a ~40% spike in Brent crude, is the latest in this sequence. From an investor’s point of view, the question that must be asked is whether current market levels already reflect the risks?
Markets tend to bottom before the crisis ends
Why? Because markets are forward-looking, they price in the worst early and move on expectations, not current reality.
A classic example is the COVID-19 crash. The Nifty bottomed in late March 2020, exactly when uncertainty was at its peak ( rising cases, lockdown, and no clarity on vaccines). Despite the worsening situation on the ground, markets began to rally soon after. By the time economic conditions actually started improving, markets had already moved significantly higher, reinforcing how they tend to price in the future rather than react to the present.
| # | Crisis | Start date | Nifty bottom date | End date* | 1Y forward return |
|---|---|---|---|---|---|
| 1 | Ketan Parekh Scam + Dotcom | Mar 2000 | Sep 21, 2001 | Oct 2002 | 14.2% |
| 2 | 2004 Election Shock | May 2004 | May 17, 2004 | Late Jun 2004 | 57.3% |
| 3 | Global Financial Crisis | Sep 2008 | Oct 27, 2008 | Jun–Jul 2009 | 121.2% |
| 4 | Taper Tantrum / INR-CAD Crisis | May 2013 | Aug 28, 2013 | Sep 2013 | 56.5% |
| 5 | Yuan Devaluation + NPA Cycle | Aug 2015 | Feb 29, 2016 | Jun–Jul 2016 | 31.1% |
| 6 | Demonetisation | Nov 2016 | Dec 26, 2016 | Mar–Apr 2017 | 34.6% |
| 7 | IL&FS / NBFC Crisis | Sep 2018 | Oct 26, 2018 | Feb–Mar 2019 | 17.1% |
| 8 | Pulwama + Balakot | Feb 2019 | Feb 19, 2019 | Mar 2019 | 15.5% |
| 9 | COVID-19 Crash | Mar 2020 | Mar 23, 2020 | Nov 2020 | 98.2% |
| 10 | Adani–Hindenburg Shock | Jan 2023 | Mar 28, 2023 | May 2023 | 33.2% |
| 11 | US Liberation Day Tariff Shock | Apr 2, 2025 | Apr 7, 2025 | Apr 9, 2025 | 7.6% |
| 12 | US–Iran Conflict | Feb 28, 2026 | Mar 30, 2026 | Ongoing | NA |
Source: Media Reports, NSE. *Note: The end date is generally taken as per the media articles, suggesting a conclusion of the event.
Now, considering the current context, let’s assess if markets have priced in the geopolitical risks.
Current valuations: What does history suggest?
Nifty50 is trading at a PE of 20.81, within the 18–21 band-a zone that has historically delivered ~15% 1-year returns. The recent correction has brought valuations back from expensive levels to a more supportive range. At these levels, markets are not expecting perfect outcomes, which reduces downside risk and leaves room for upside.
Historically, lower Nifty PE levels have led to stronger 1–3 year returns.
| PE Band | 1Y average | 3Y average CAGR |
|---|---|---|
| PE < 12 | 47.0% | 45.0% |
| PE 12–15 | 74.0% | 21.0% |
| PE 15–18 | 27.0% | 13.0% |
| PE 18–21 (Current PE) | 15.0% | 11.0% |
| PE 21–24 | 9.0% | 8.0% |
| PE 24–27 | −0.9% | 9.0% |
Source: Media Reports, NSE, Trendlyne. *Note: The analysis is based on monthly observations (from Jan 2006 – Mar 2026) using NSE Nifty 50 PE data. Forward returns are calculated over 12-month and 36-month (CAGR holding periods from month-end closing levels)
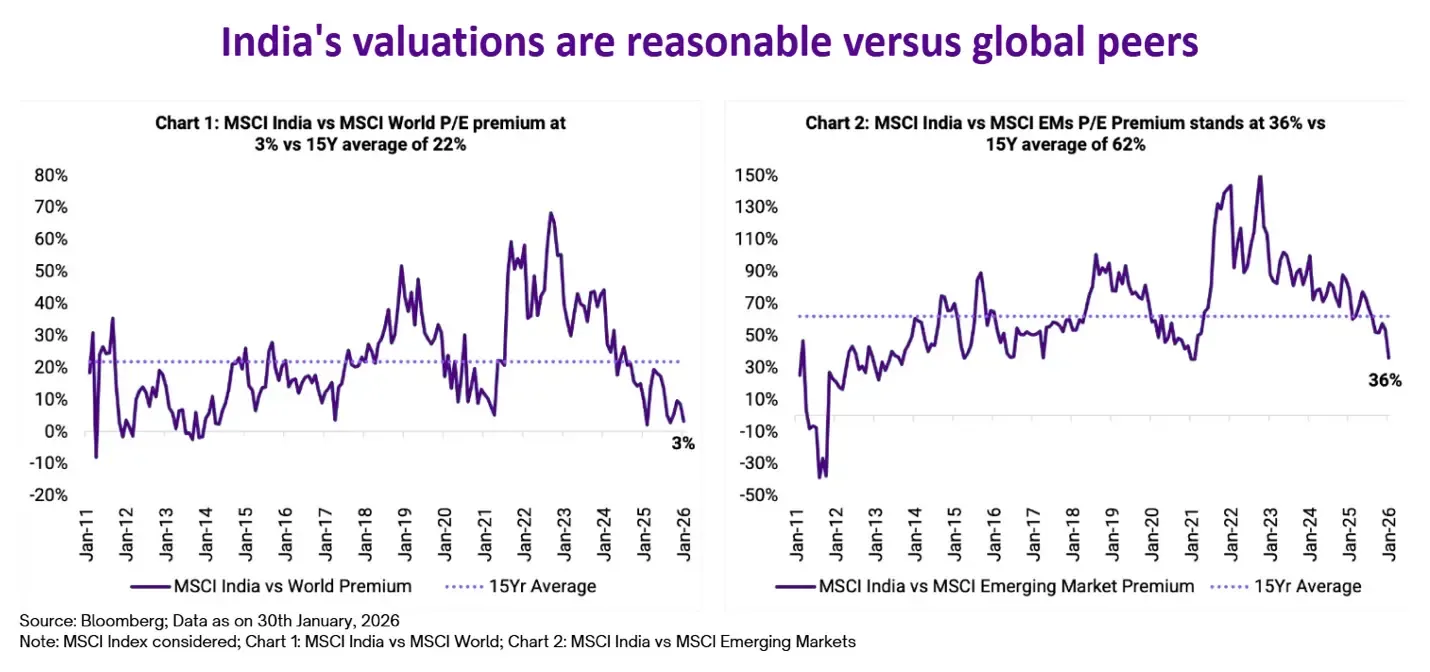
Even in the global context, Indian markets' valuations have become reasonable considering their growth potential
India VIX: Fear appears to be subsiding
India VIX, a measure of market fear, rose from ~13.7 to ~27.2 during the recent conflict and has since eased, suggesting that peak panic may be behind us.
When VIX moves above 25, markets often enter what is called the “vampire phase,” where, despite negative news, markets stop falling sharply. This happens because fear is already high, most bad news is priced in. As a result, selling pressure reduces and declines become smaller.
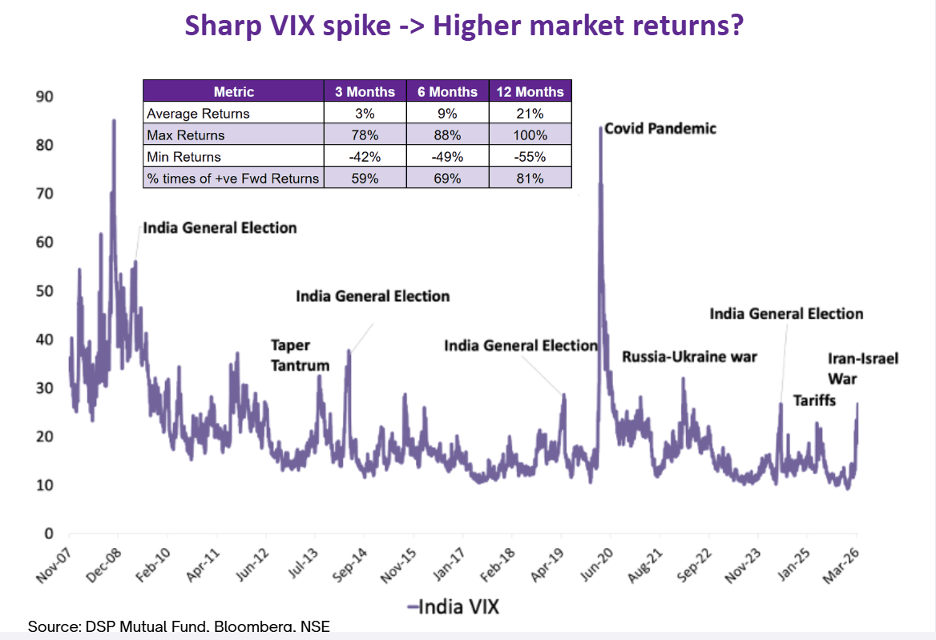
History also supports this. Across past events like the GFC, COVID, and other crises, VIX spikes have been followed by strong recoveries, with average 1-year returns of ~53% and all instances delivering positive returns over the next 12 months. Even specifically, when VIX crosses 25, markets have delivered 1-year positive returns with ~80% probability of gains.
| Crisis / Event | VIX Peak | VIX Date | Nifty 50 Bottom | Fall % | Nifty 50 1Y Return |
|---|---|---|---|---|---|
| Global Financial Crisis | 85 | Nov 2008 | 2,252 | -55.7% | 121.2% |
| European Debt Crisis | 42 | Dec 2011 | 4,531 | -28.5% | 28.2% |
| Taper Tantrum | 38 | Aug 2013 | 5,119 | -18.2% | 56.4% |
| China Slowdown | 29 | Feb 2016 | 6,826 | -26.2% | 31.8% |
| IL&FS / NBFC Crisis | 28 | Oct 2018 | 10,004 | -15.4% | 17.2% |
| COVID-19 Crash | 86.6 | Mar 2020 | 7,610 | -38.2% | 98.2% |
| Russia-Ukraine / Rate Hike | 24 | Jun 2022 | 15,183 | -17.3% | 18.3% |
| US-Iran War (West Asia) | 27.17 | Mar 2026 | 22,331 | -17.1% | NA |
Source: NSE India, Media Articles. *Returns from the bottom made on March 30, 2026.
Key risks
-
Crude oil spikes: Crude oil spikes are negative for markets, especially for a net importer like India. This continues to remain a key overhang on Indian market. Encouragingly, escalations in West Asia have started to ease off and that should translate into lower oil prices.
-
Escalation beyond current scope: If the conflict draws in additional regional actors or disrupts oil supply routes for a prolonged period, the crude shock could prove more structural - weighing on India's current account deficit, the rupee, and inflation for longer than markets currently anticipate
-
Sustained FII outflows: Dollar strength and risk-off positioning globally could keep foreign institutional selling elevated, adding downward pressure on Indian equities in the near term
-
Domestic inflation pass-through: Elevated crude prices feed into fuel, logistics, and food costs. If inflation remains above the RBI's upper tolerance band, the pace and extent of rate cuts - which the market had begun pricing in - may be delayed
-
Earnings estimate revisions: Sectors with significant energy cost exposure - paints, chemicals, aviation, logistics - may see downward earnings revisions if crude remains elevated into FY27
Before you go
Markets have declined ~15% from their recent peak of Jan-25 , crude has spiked, and near-term visibility is limited. These are the conditions that, historically, have characterised the latter stages of a correction rather than its beginning. Market bottoms are rarely visible in real time. What the data does suggest is that attempting to time an exit - and subsequently a re-entry - has tended to cost more than staying invested through the volatility. The underlying structural drivers of Indian economic growth have not changed materially. The crisis, as with its predecessors, will in due course resolve.
About The Author
Next Story
