Market News
Trade setup for Jan 22: NIFTY50 forms bearish engulfing candle as volatility spikes
.png)
4 min read | Updated on January 22, 2025, 07:21 IST
SUMMARY
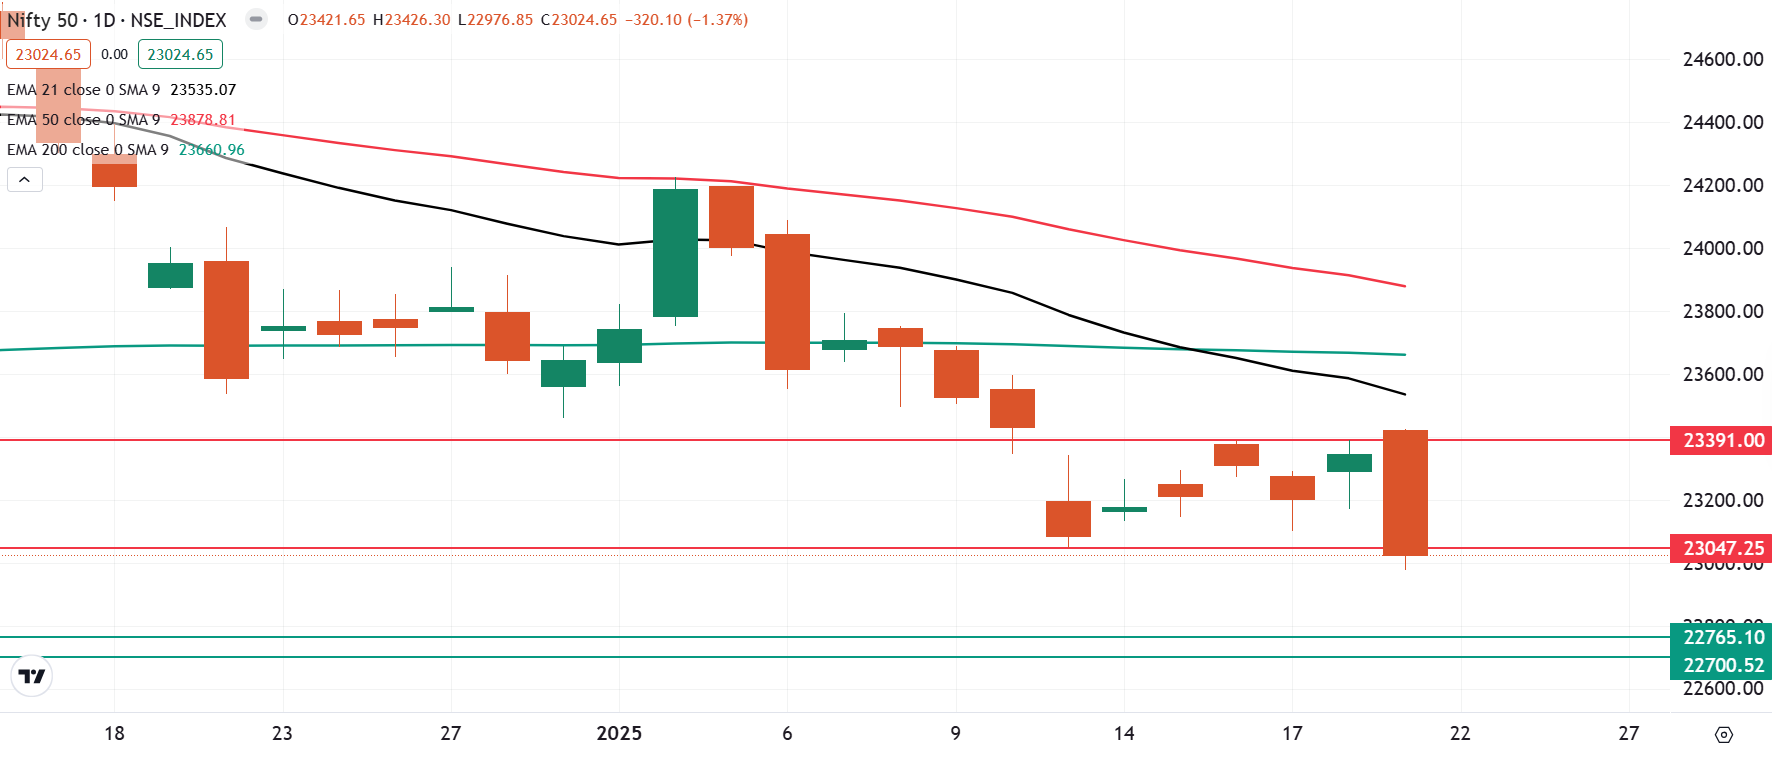
After a sharp fall of over 1%, the NIFTY50 index formed a bearish engulfing candle on the daily chart. It is a strong reversal pattern that occurs when a larger bearish (red) candle completely engulfs the previous day's bullish (green) candle, signaling a potential trend reversal. However, the pattern gets confirmed if the close of the subsequent candle is below the reversal pattern.
Stock list

The NIFTY50 index fell by 1.3%, wiping out all the gains from the previous session.
Asian markets @ 7 am
- GIFT NIFTY: 23,151.50 (+0.15%)
- Nikkei 225: 39,575.69 (+1.40%)
- Hang Seng: 19,997 (-0.54%)
U.S. market update
- Dow Jones: 44,026(▲1.2%)
-
- S&P 500: 6,049 (▲0.8%)
- Nasdaq Composite: 19,756 (▲0.6%)
U.S. indices surged on Tuesday, with the Dow Jones climbing above 44,000 and the S&P 500 crossing the 6,000 mark as investors analysed President Donald Trump's initial policy actions. Markets opened with optimism, as Trump refrained from announcing the widely anticipated across-the-board tariff hikes on his first day back in office.
The rally came after a long weekend, as U.S. markets were closed on Monday for the Martin Luther King Jr. holiday. Investors are now closely watching Trump's next steps and their potential impact on the market.
NIFTY50
January Futures: 23,103 (▼1.2%) Open interest: 5,82,904 (▲3.1%)
The NIFTY50 index fell by 1.3%, wiping out all the gains from the previous session. It formed a Bearish Engulfing candlestick pattern on the daily chart, which suggests weakness. Additionally, the index also slipped below the crucial support of 23,000 during intraday, adding to concerns.
The index also broke its six day consolidation zone and ended the day below previous week’s low, indicating weakness. If it surrenders 23,000 mark on closing basis then it may extend the decline upto 22,700 zone. On the flip side, the immediate resistance for the index remains at 23,400.

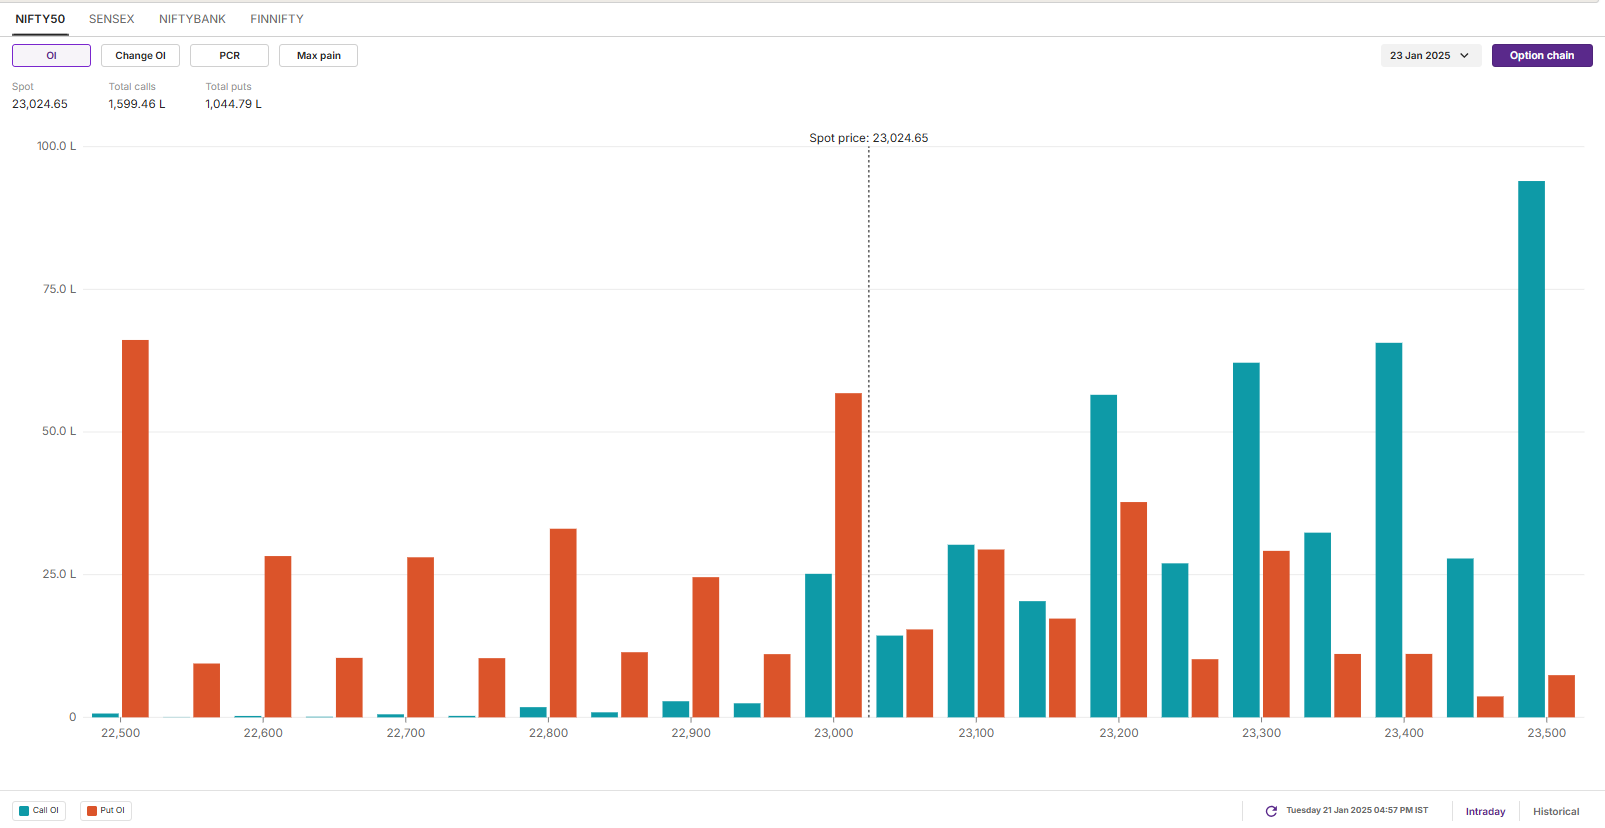
Meanwhile, the open interest data for the 30 January saw significant call build-up at 23,500 strike, marking it as crucial resistance for the index. On the flip side, the put base saw unwinding from 23,000 strike and shifted to 22,500, suggesting support for the index around this zone.

SENSEX
- Max call OI: 76,000
- Max put OI: 76,000
- (Expiry: 28 Jan)
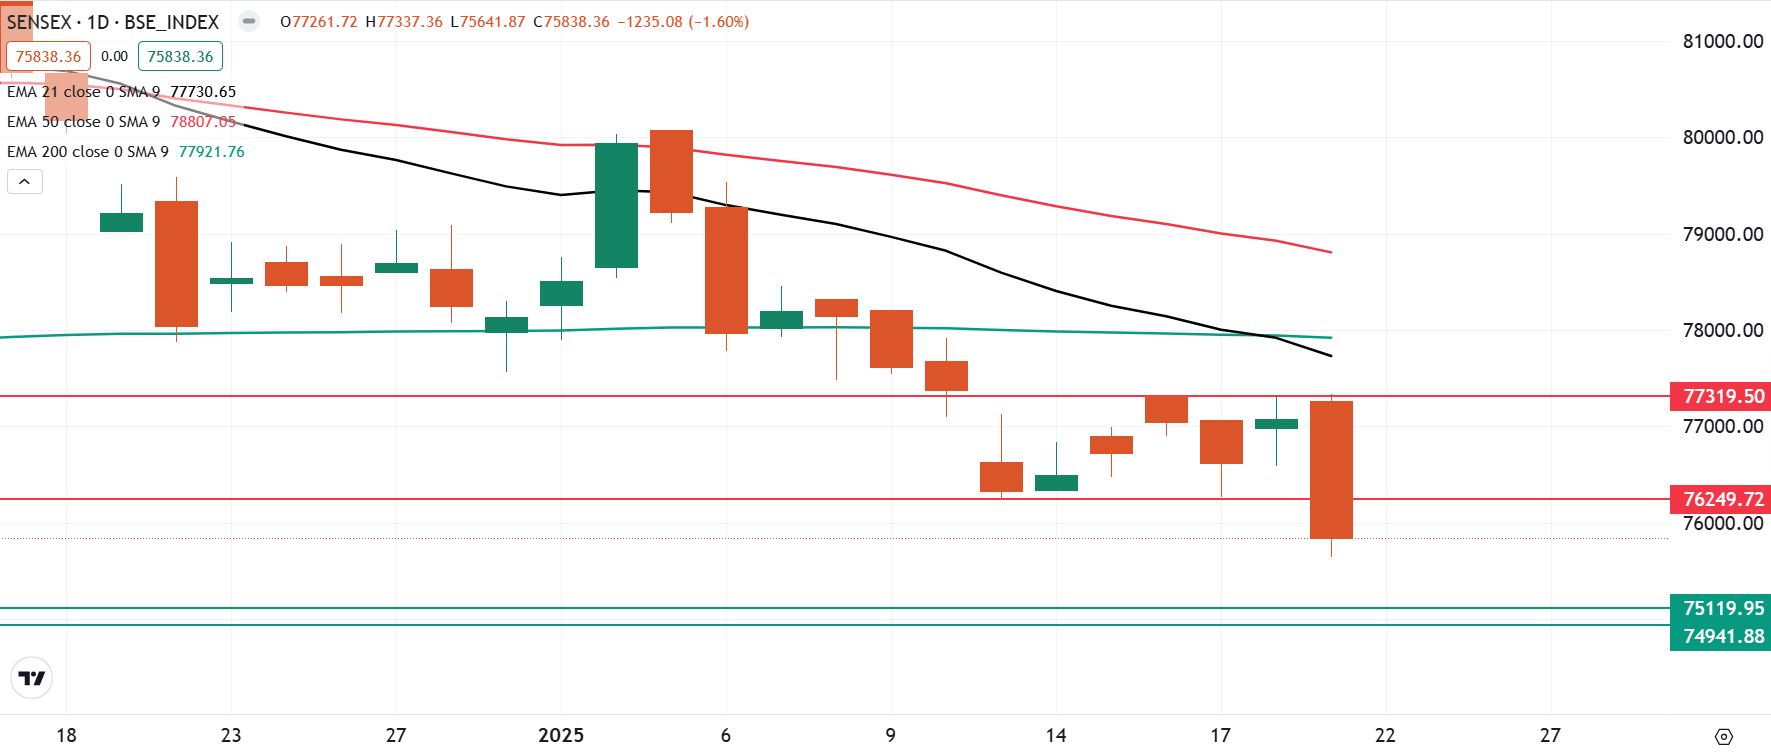
The SENSEX struggled to hold onto its opening gains and experienced significant intraday volatility on the weekly expiry of its options contracts. The index fluctuated sharply, swinging over 1,000 points in both directions, indicating increased market uncertainty.
The index also formed a bearish candlestick pattern on the daily chart, breaking out of its six-day consolidation phase. In the coming sessions, traders should closely watch the 76,000 level. A daily close below this key zone would confirm the bearish engulfing pattern, signaling further downside potential. Conversely, a bullish reversal can only be expected if the index reclaims the 77,300 level on a closing basis.

FII-DII activity
Stock scanner
- Long build-up: Dalmia Bharat
- Short build-up: Dixon Technologies, MCX, Oberoi Realty, Zomato, Policy Baazar and Trent
- Under F&O ban: Aditya Birla Fashion and Retail, Angel One, Bandhan Bank, Kalyan Jewellers, Can Fin Homes, Dixon Technolgies, Manappuram Finance, L&T Finance, Mahanagar Gas and RBL Bank
- Added under F&O ban: Dixon Technolgies and Mahanagar Gas
- Out of F&O ban: NIL
In Futures and Options or F&O, long build-up means an increase in Open Interest (OI) along with an increase in price, and short build-up means an increase in Open Interest(OI) along with a decrease in price. Source: Upstox and NSE.
Disclaimer: Derivatives trading must be done only by traders who fully understand the risks associated with them and strictly apply risk mechanisms like stop-losses. The information is only for consumption by the client and such material should not be redistributed. We do not recommend any particular stock, securities and strategies for trading. The securities quoted are exemplary and are not recommendatory. The stock names mentioned in this article are purely for showing how to do analysis. Take your own decision before investing.
About The Author
Next Story


