Market News
Union Bank to Canara Bank: PSU Bank stocks on the rise today; check details
.png)
4 min read | Updated on May 19, 2025, 11:21 IST


SUMMARY
PSU bank stocks have lagged in 2025, with many declining sharply despite solid Q4 earnings and supportive macro factors. Technical charts show PSU banks breaking a falling wedge pattern, signalling a potential bullish breakout.
Stock list

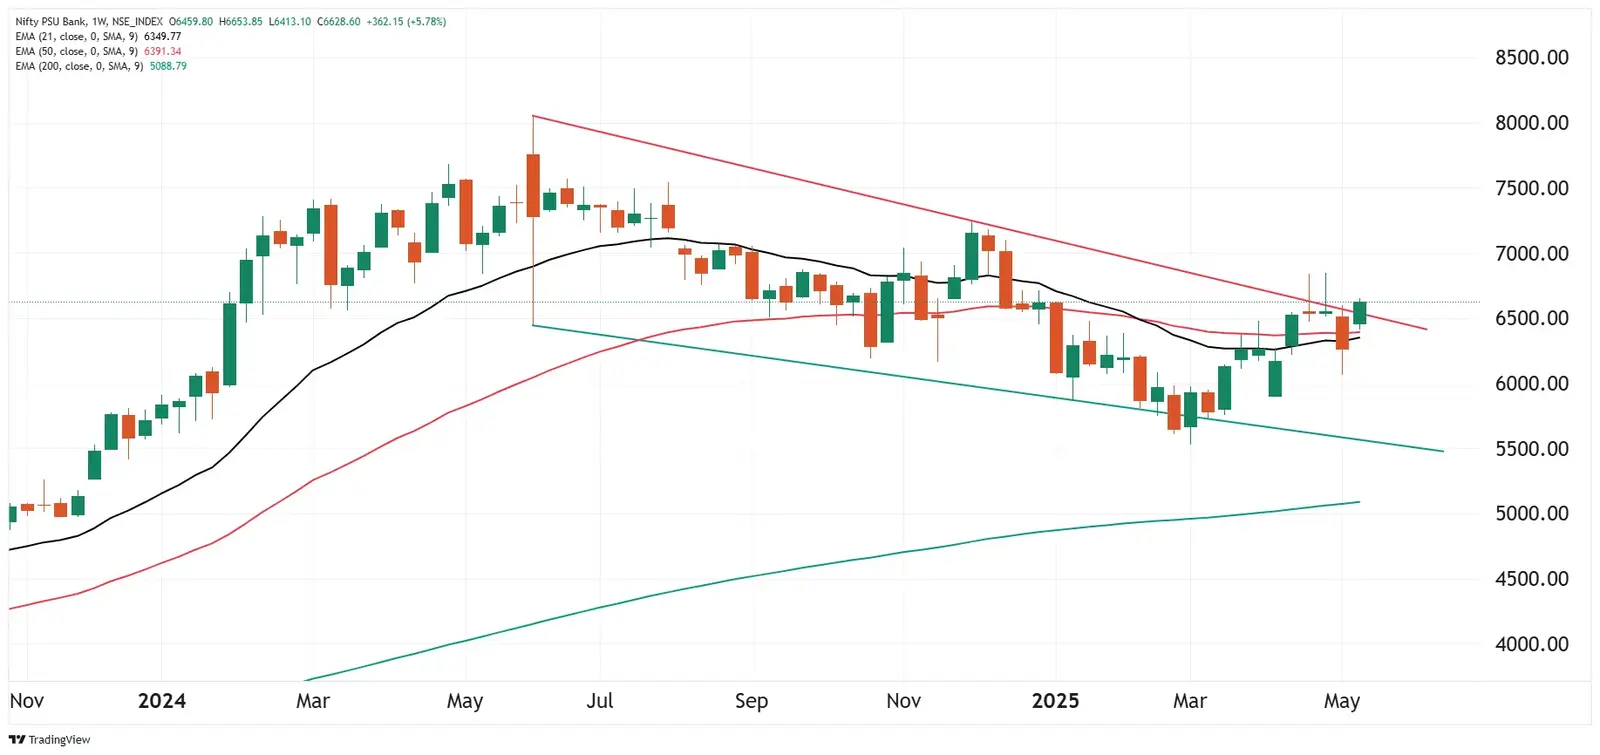
NIFTY PSU Bank index reclaimed its 21-week and 50-week exponential moving averages and jumped 5% last week. | Image: Shutterstock
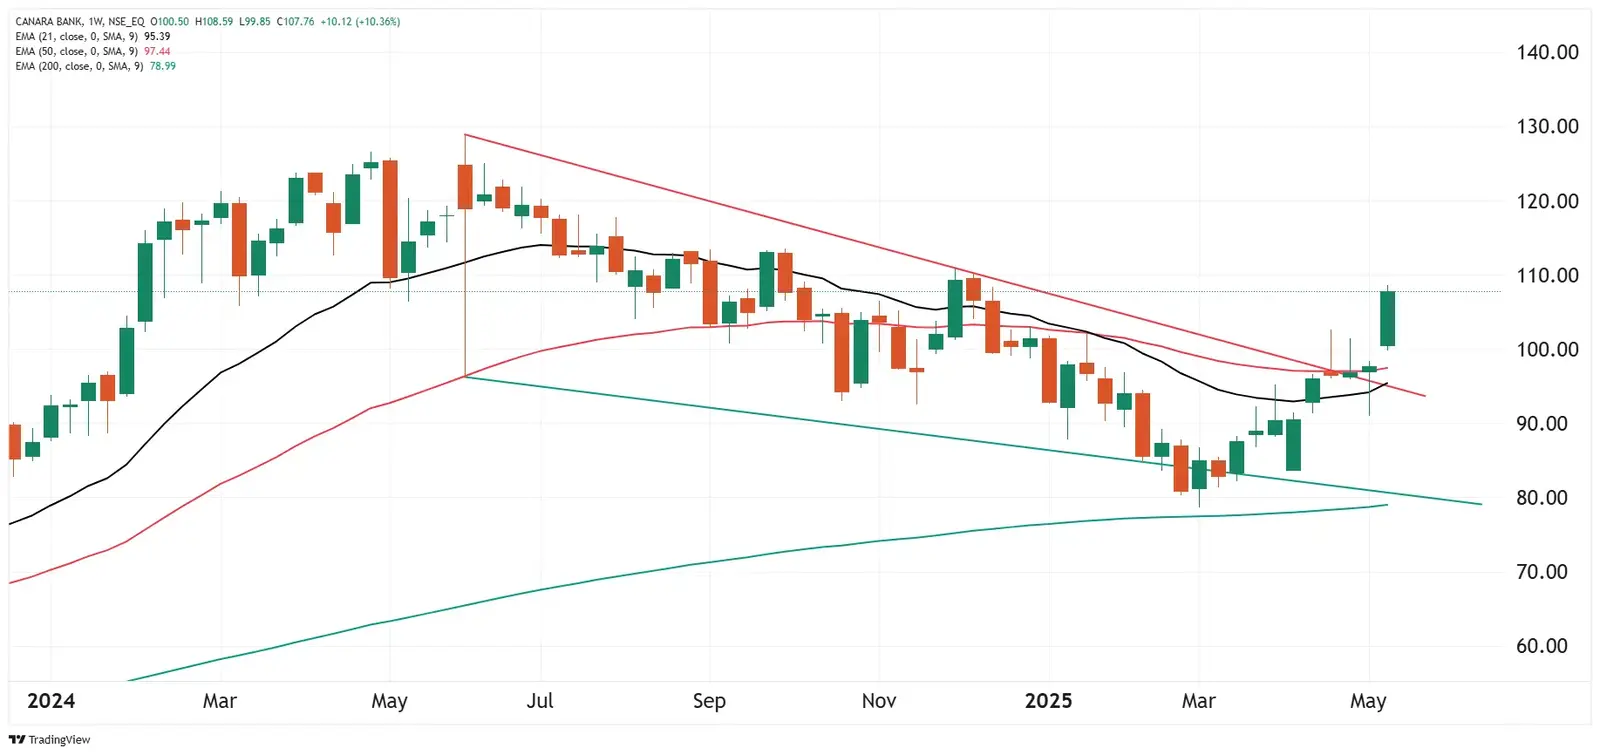
PSU bank stocks are in the spotlight. Shares of Canara Bank, Indian Bank, Union Bank of India and others gained between 7-10% last week while the NIFTY PSU Bank Index closed up 5.7%.
The significant rally came on the back of robust quarterly results announced by several PSU banks. Canara Bank's Q4 net profit rose 33% year-on-year (YoY) to ₹5,004 crore, while net interest income (NII) for Q4 FY25 was ₹9,441 crore.
Meanwhile, Union Bank of India, reported a 50% (YoY) rise in net profit to ₹4,985 crore on the back of a doubling of treasury gains, while NII for the March quarter was flat at ₹9,514 crore.
Overall, the PSU bank's March quarter earnings were in line with market expectations, driven by a rise in gross advances and domestic deposits. Meanwhile, asset quality across the sector has remained largely stable, which is a positive sign for banks.
Most of the banks have also announced positive dividend payout for FY25, with Canara Bank declaring a dividend of ₹4 per share and Union Bank of India's board recommending a final dividend of ₹4.75 per share for FY25. Other banks have also announced similar dividend payouts. This is positive for shareholders, including the government of India, which expects a record dividend payout of ₹2.56 lakh crore from RBI and state-owned banks in FY26.
Earlier this year, the Reserve Bank of India's (RBI) decision to infuse ₹1.5 lakh crore worth of liquidity into the banking system was a positive trigger for the banking sector, as the move came as a major relief to the banking system's liquidity, which was at a deficit of ₹3.1 lakh crore. So far this year, the NIFTY Bank Index has gained 8.8%.
Technical view
NIFTY PSU Bank index reclaimed its 21-week and 50-week exponential moving averages and jumped 5% last week. The index has also moved out of the falling wedge pattern on the weekly chart connecting the swing highs of June 2024 and December 2024.
It is a bullish chart pattern involving two converging, downward-sloping trend lines. In this pattern, the price makes lower highs and lower lows, indicating decreasing selling pressure and the potential for an upside trend reversal. It usually appears after a downtrend, suggesting that buyers are gaining momentum and may soon break above the upper resistance line.
Key stocks on radar
It is a chart pattern formed by two converging trendlines with one sloping down and the other sloping up, indicating market indecision. It often signals a potential breakout in either direction, depending on the preceding trend and volume.
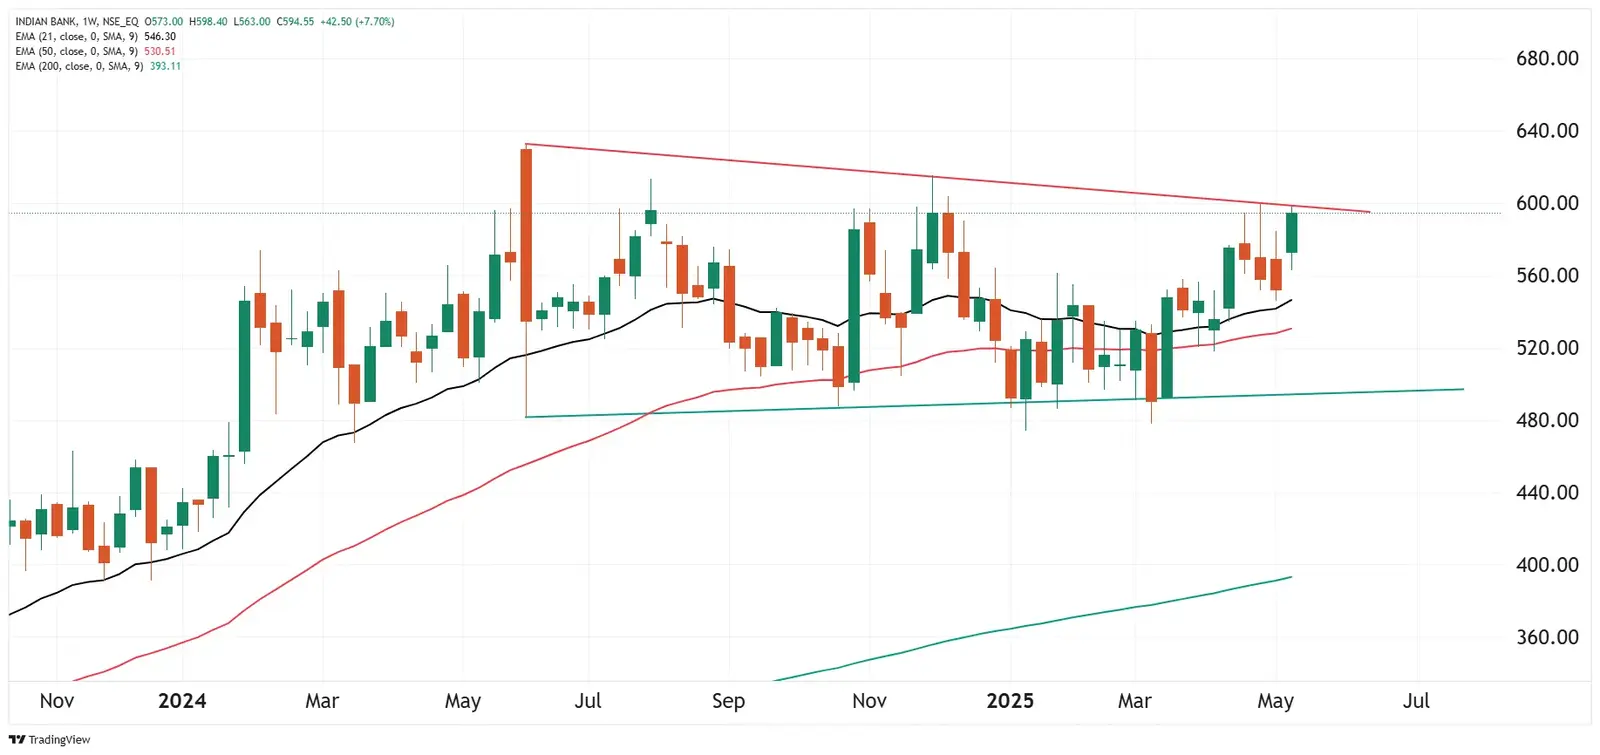
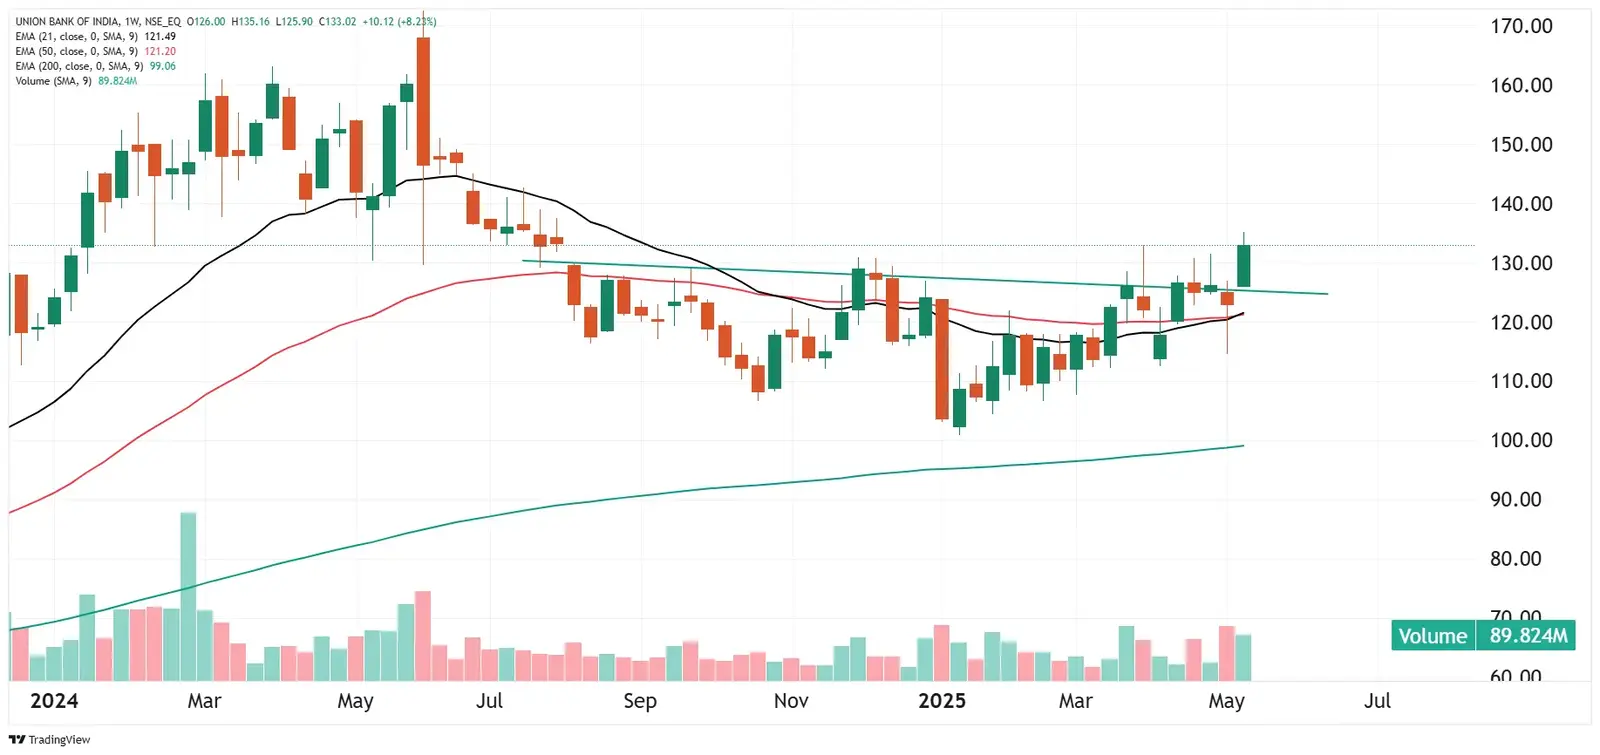
Bullish outlook on Canara Bank, Indian Bank and Union Bank of India
For example, let’s look at Canara Bank.
About The Author
Next Story


