Market News
HUL, Godrej Consumer, Nestle India in focus amid demand revival and monsoon boost; check key technical levels
.png)
3 min read | Updated on July 08, 2025, 09:59 IST


SUMMARY
FMCG stocks were in action on July 7 after upbeat updates from Godrej Consumer, Dabur, and Marico, hinting at improving demand. Godrej Consumer led the surge on hopes of double-digit revenue growth.
Stock list
Hindustan Unilever witnessed strong traction as it reclaimed 200-day exponential moving average (EMA) after eight months.
Following a subdued performance, FMCG companies are showing signs of revival, attracting the attention of investors as demand improves. Recent business updates from Godrej Consumer, Dabur and Marico introduced fresh optimism into the market. These companies reported better-than-expected growth in both volume and revenue, suggesting a potential turnaround for the sector. As a result, the Nifty FMCG Index rose 1.6%, while the broader market remained flat.
The renewed confidence was due to several key factors. A favourable monsoon is expected to boost rural demand, and early signs of an urban consumption revival are also supporting sentiment. For example, Godrej Consumer has reported improving volume trends and is targeting double-digit revenue growth, while Dabur's outlook, though modest, has exceeded investor expectations.
However, experts caution that this may not yet be an industry-wide trend. The gains are largely concentrated in companies with stronger growth visibility, such as Godrej Consumer and Marico. Nevertheless, the broad optimism fueled by expectations of an uptick in rural demand and the government's focus on consumption could spill over to other players in the sector.
Stocks in focus
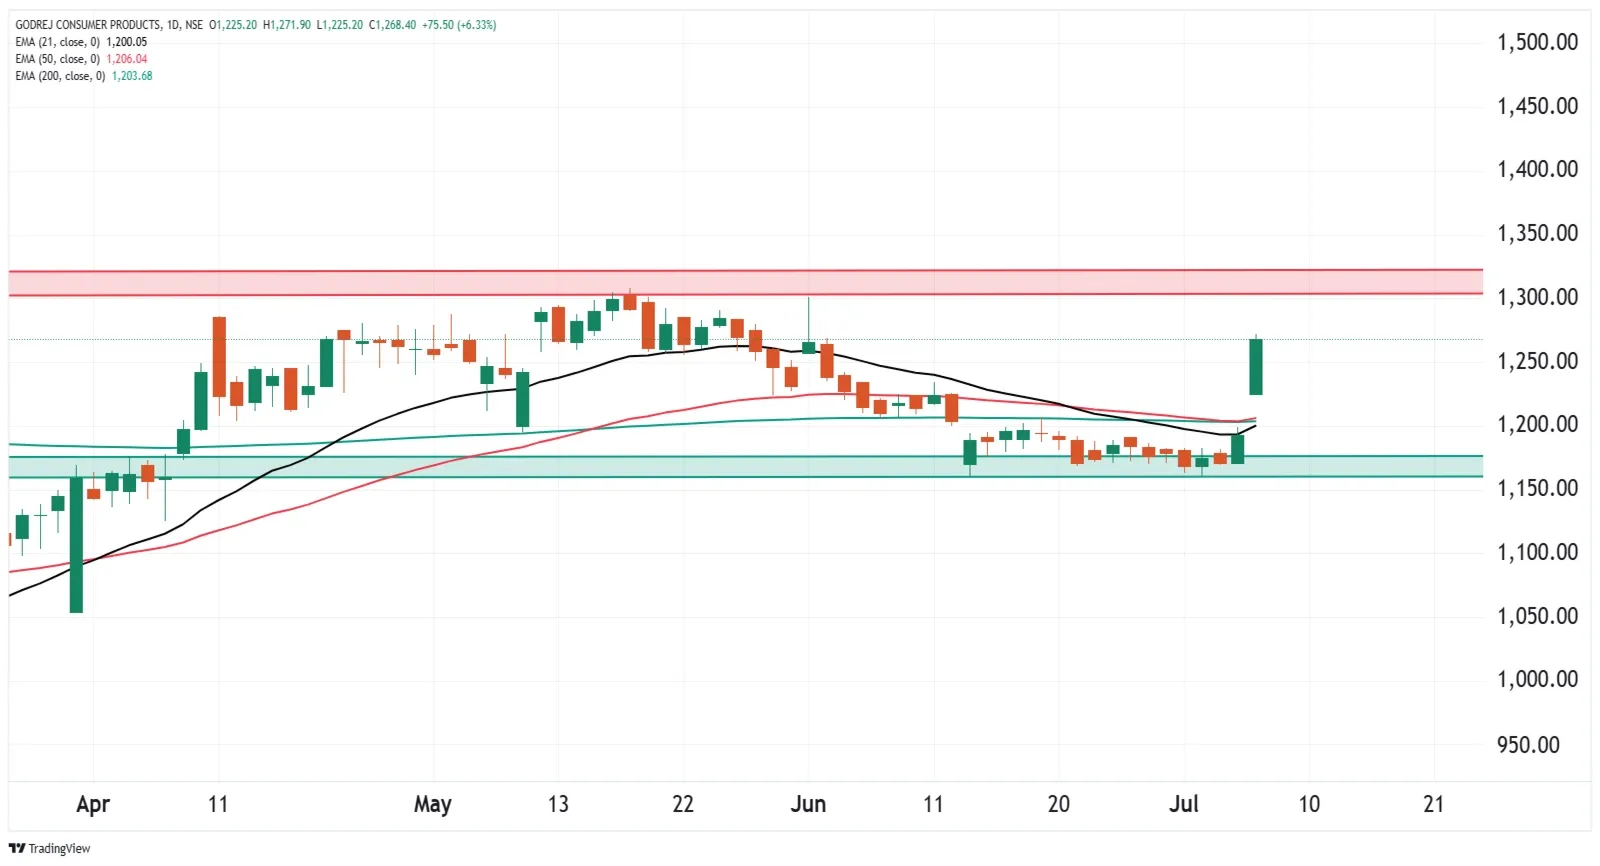
Godrej Consumer Products started the week on a bullish note and jumped over 6%. It reclaimed all the three key exponential moving averages like 21,50 and 200 on the daily chart, indicating support based buying. For the upcoming sessions, the ₹1,150 zone will act as immediate support, while immediate resistance is around ₹1,300 zone.
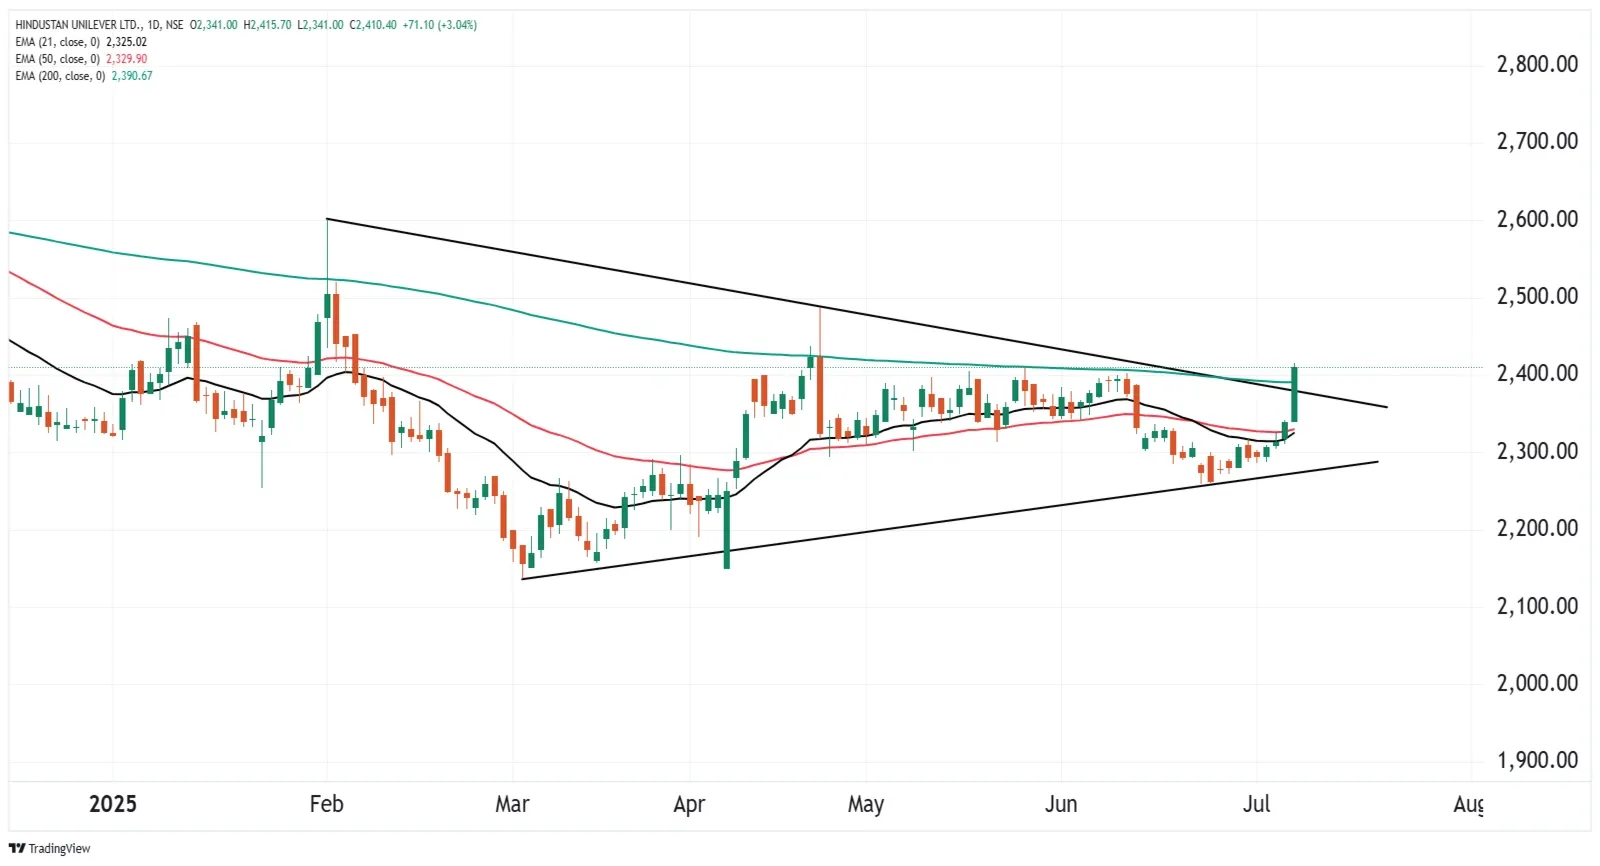
Hindustan Unilever also witnessed strong traction as it reclaimed its 200-day exponential moving average (EMA) after eight months and jumped over 3%. The stock also closed above its 21-day and 50-day EMAs on July 4 and formed a bullish candle on the daily chart. From the technical standpoint, the immediate support for Hindustan Unilever is around ₹2,300 zone, while the resistance is placed at ₹2,500.
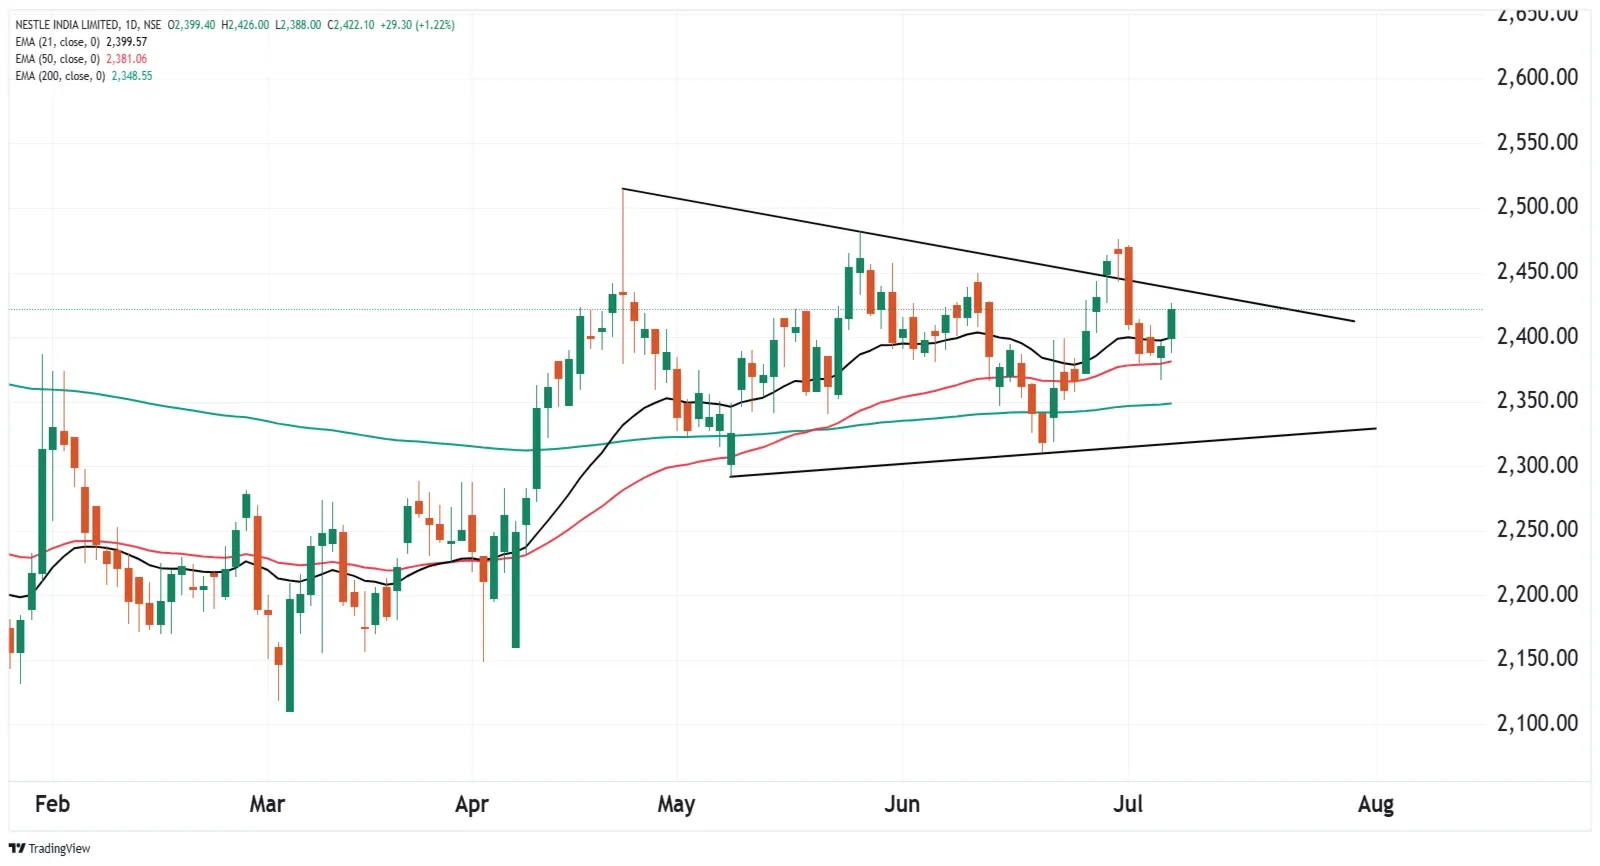
Nestle India began the week on a strong footing, buoyed by a bullish technical signal as its 21-week exponential moving average crossed above the 50-week average in the previous week. Additionally, it reclaimed its 21-day EMA on the daily chart and closed Monday's session above the high of the last four sessions. Moreover, for short-term clues, traders can monitor the symmetrical triangle chart pattern on the daily chart. A breakout or breakdown of the pattern will provide further clues.
For example, let’s look at the options structure of Hindustan Unilever to understand the strategy.
The strategy involves buying an ATM call and selling a call option one strike above it. This implies the breakeven point of 2,429, which is 0.8% above Monday’s close. Meanwhile, the bull put spread involves selling the ATM put and buying a put option one strike below it.
Disclaimer:
Derivatives trading must be done only by traders who fully understand the risks associated with them and strictly apply risk mechanisms like stop-losses. The information is only for educational purposes. We do not recommend any particular stock, securities and strategies for trading. The stock names mentioned in this article are purely for showing how to do analysis. Take your own decision before investing.
About The Author
Next Story


