Market News
Trade setup for Jan 21: NIFTY50 rebounds from day’s low, forms support around 23,000
.png)
4 min read | Updated on January 21, 2025, 07:30 IST
SUMMARY
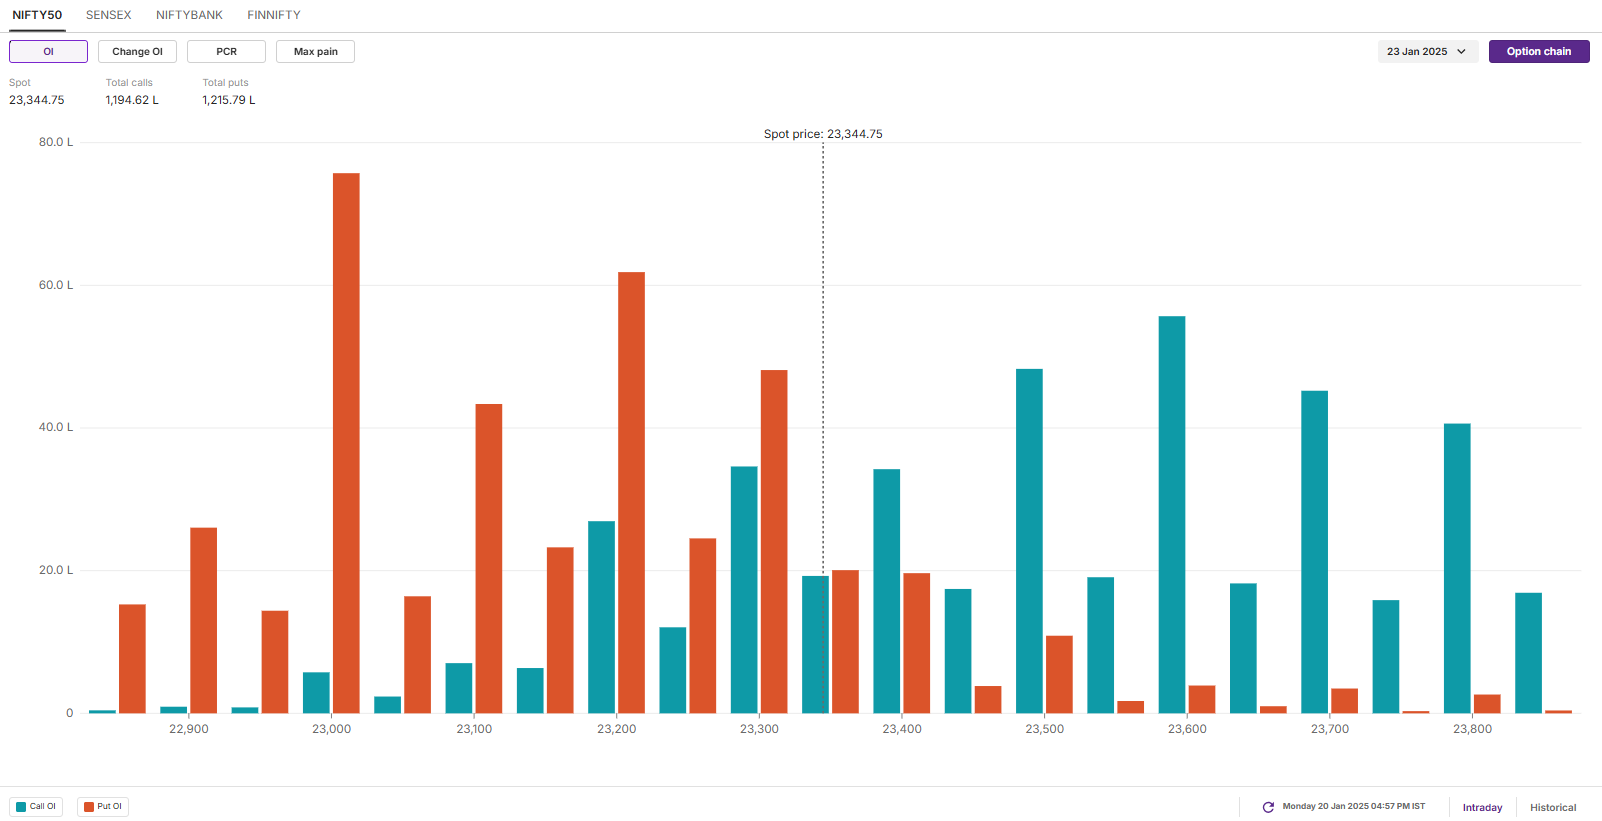
According to the options data for the January 23 expiry, the NIFTY50 index saw a significant put build-up at the 23,000 strike, suggesting support for the index around this zone.
Stock list

The SENSEX kicked off Monday's session on a positive note and managed to close slightly above the previous session’s high.
Asian markets @ 7 am
- GIFT NIFTY: 23,405.5 (-0.33%)
- Nikkei 225: 38,881.78 (-0.05%)
- Hang Seng: 20,058.10 (+0.56%)
U.S. market update
U.S. indices and bond markets were closed for Martin Luther King Jr. Day on Monday. Meanwhile, U.S. President Donald Trump took oath as the 47th President of the United States of America.
In his inaugural address, the U.S. president said he would declare a national emergency at the southern border and move to increase oil production. He added that the government would recognise only two genders, again threatened to take control of the Panama Canal and vowed to send American astronauts to Mars.
NIFTY50
- January Futures: 23,400 (▲0.4%)
- Open interest: 5,65,350 (▲0.7%)
The NIFTY50 remained in a tight range but managed to recover from the previous day's losses, suggesting buying interest at lower levels. However, market volatility remained high, suggesting caution. The index is facing strong resistance in the 23,350-23,400 range, which is capping upside gains.
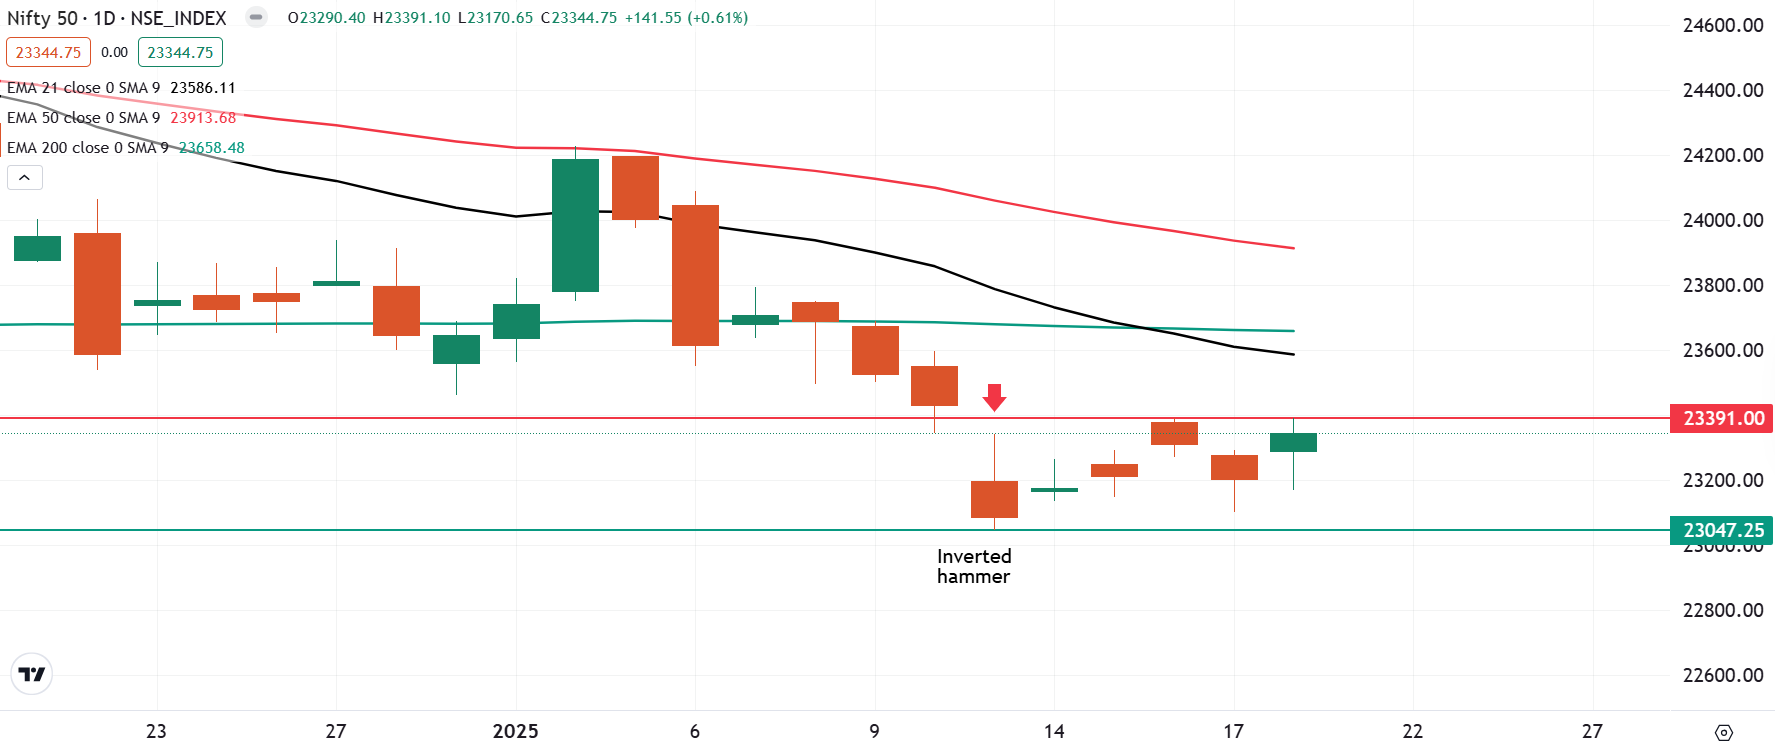
On the daily chart, the NIFTY50 index confirmed a hammer candlestick pattern—though not a classical one—and closed above the high of the reversal pattern formed on January 17. This suggests that the 23,000-22,900 zone will serve as an immediate support level for the index. On the upside, resistance is expected around the 23,600 level, which aligns with the 200-day exponential moving average (EMA).

The open interest data for the 23 January saw significant additions of put options at 23,000 strike, indicating support for the index around this zone. On the flip side, the call base was seen at 23,600, suggesting resistance for the index around this zone.

SENSEX
- Max call OI: 79,000
- Max put OI: 75,000
- (Expiry: 21 Jan)
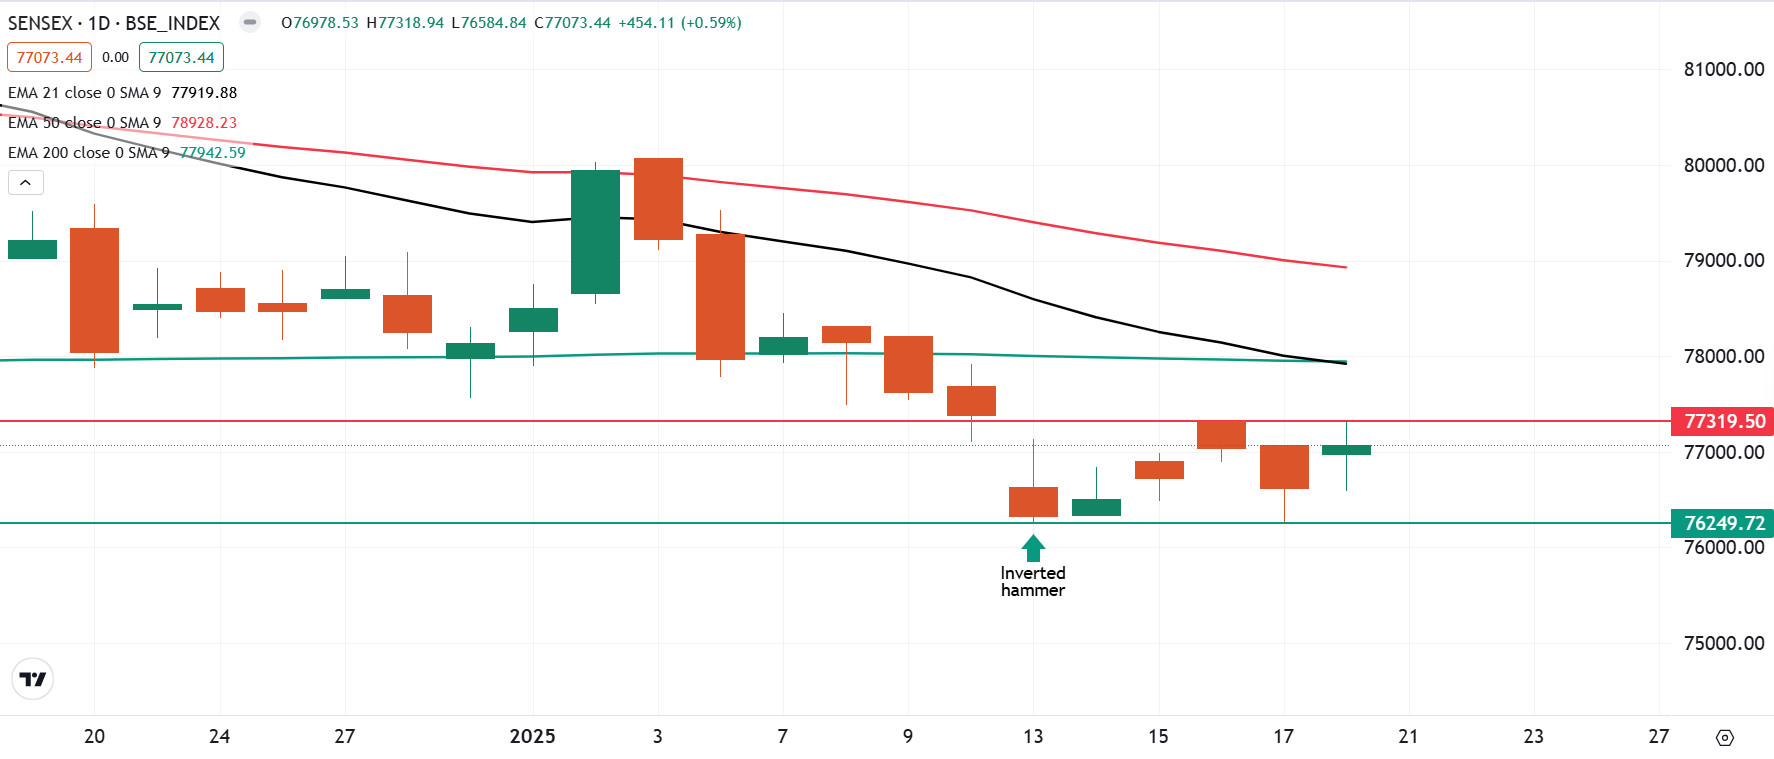
The SENSEX kicked off Monday's session on a positive note and managed to close slightly above the previous session’s high. On the daily chart, the index formed a positive candle; however, selling pressure emerged at higher levels, suggesting strong resistance around the ₹77,300 zone.

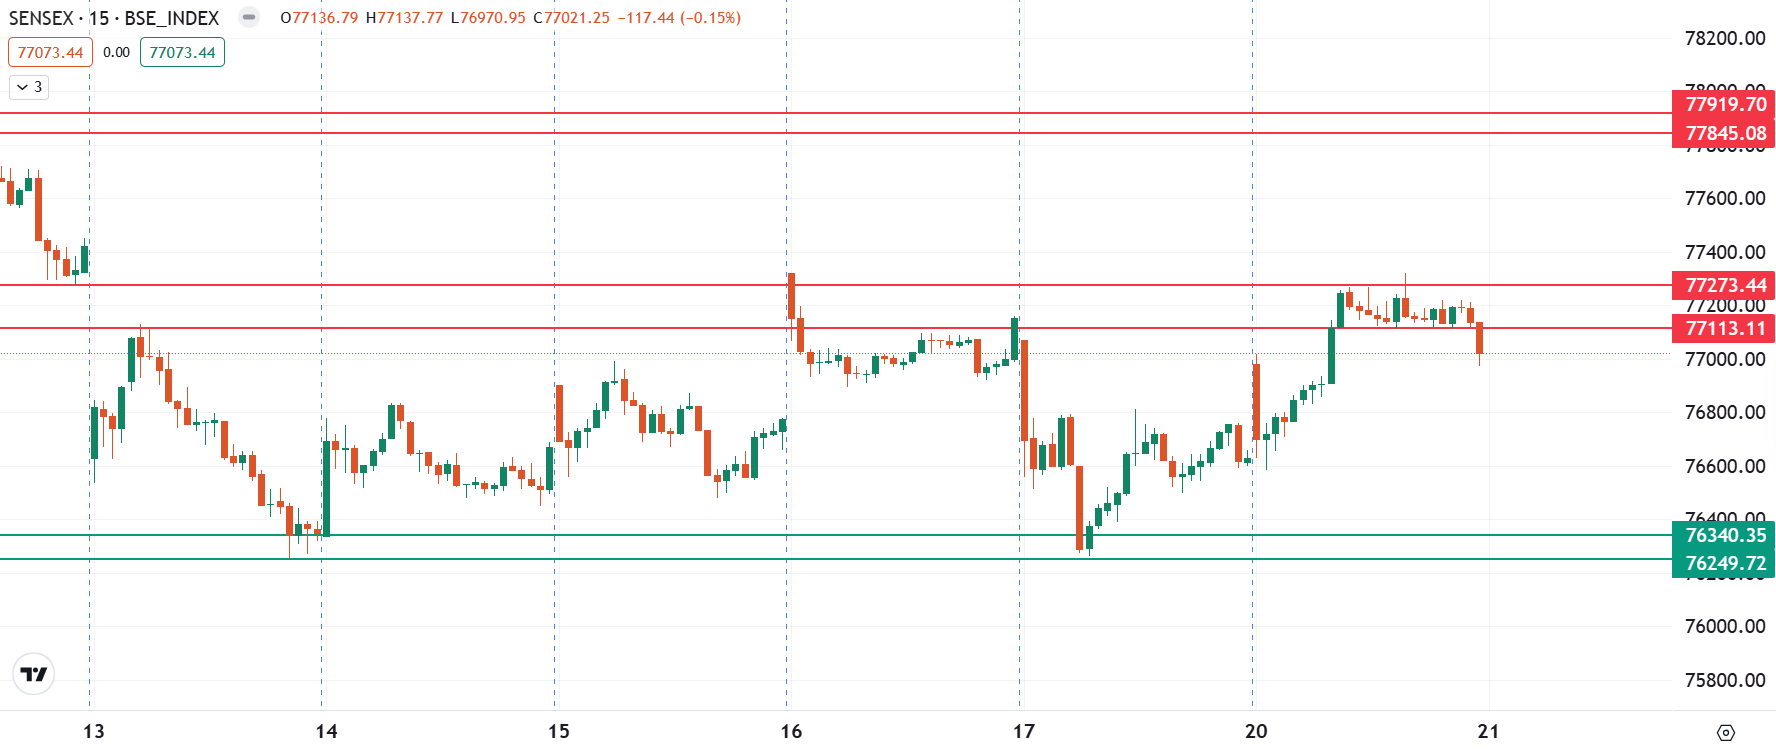
The 15-minute chart of the SENSEX indicates that the index has been range-bound over the past five trading sessions, fluctuating within the 77,300 to 76,200 range. A decisive breakout beyond this range with a strong candle is needed to signal a clear trend; otherwise, the index is likely to continue trading sideways.

FII-DII activity
Stock scanner
- Long build-up: Kotak Mahindra Bank, Wipro, United Breweries, CG Power and Bajaj Finserv
- Short build-up: Zomato, Supreme Industries, Indian Hotels and Trent
- Under F&O ban: Aditya Birla Fashion and Retail, Angel One, Bandhan Bank, Kalyan Jewellers, Can Fin Homes, Manappuram Finance, L&T Finance and RBL Bank
- Added under F&O ban: Can Fin Homes
- Out of F&O ban: Aarti Industries and Hindustan Copper
In Futures and Options or F&O, long build-up means an increase in Open Interest (OI) along with an increase in price, and short build-up means an increase in Open Interest(OI) along with a decrease in price.
Source: Upstox and NSE.
Disclaimer: Derivatives trading must be done only by traders who fully understand the risks associated with them and strictly apply risk mechanisms like stop-losses. The information is only for consumption by the client and such material should not be redistributed. We do not recommend any particular stock, securities and strategies for trading. The securities quoted are exemplary and are not recommendatory. The stock names mentioned in this article are purely for showing how to do analysis. Take your own decision before investing.
About The Author
Next Story


