Market News
PSU Bank stocks in focus: SBI, Union Bank and Canara Bank shows technical strength; check key levels
.png)
4 min read | Updated on June 02, 2025, 11:15 IST


SUMMARY
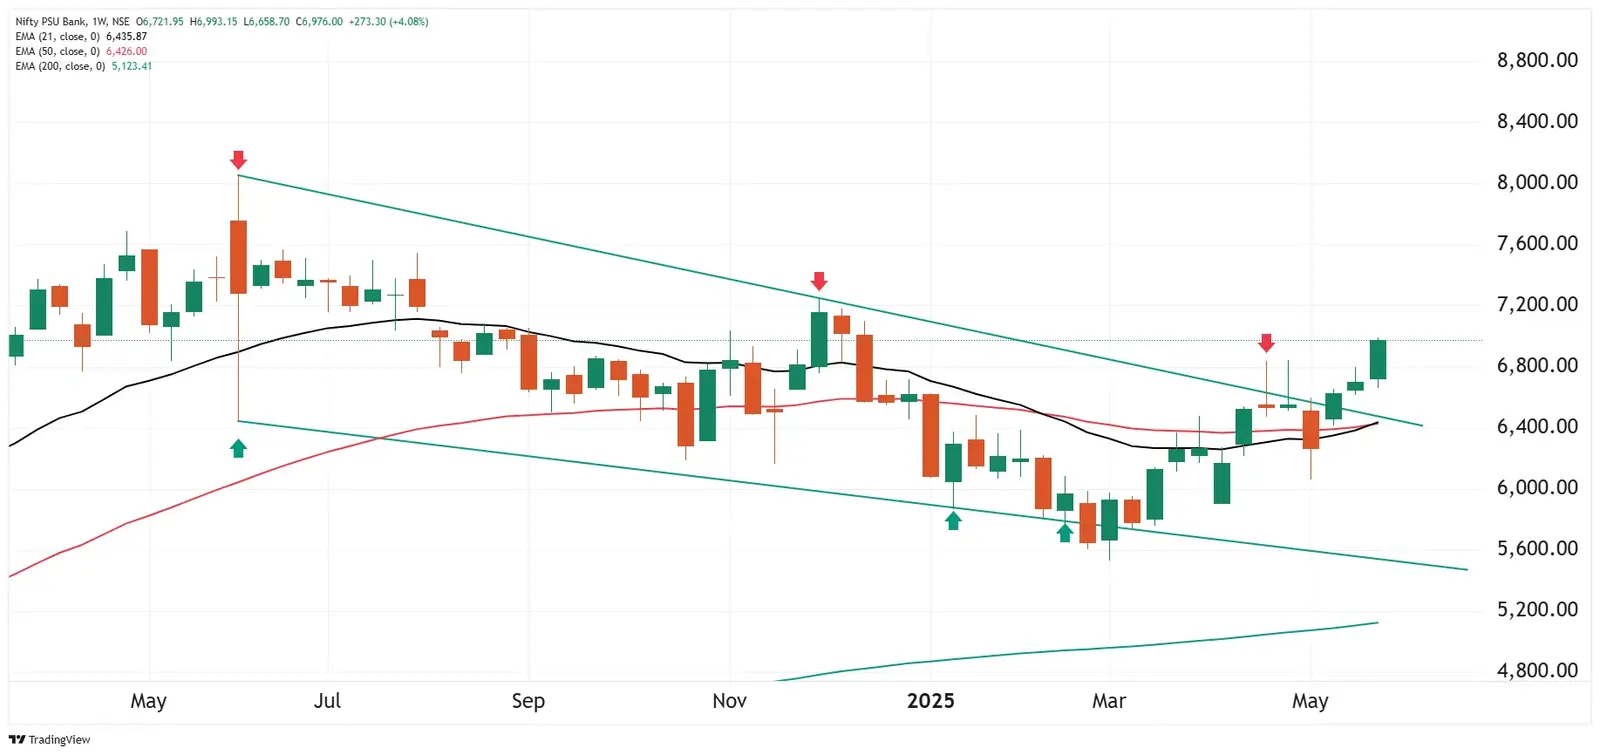
The NIFTY PSU Bank index sustained its bullish momentum after breaking out from the falling wedge pattern and has reclaimed the crucial resistance zone of ₹6,850 on a closing basis.
Stock list

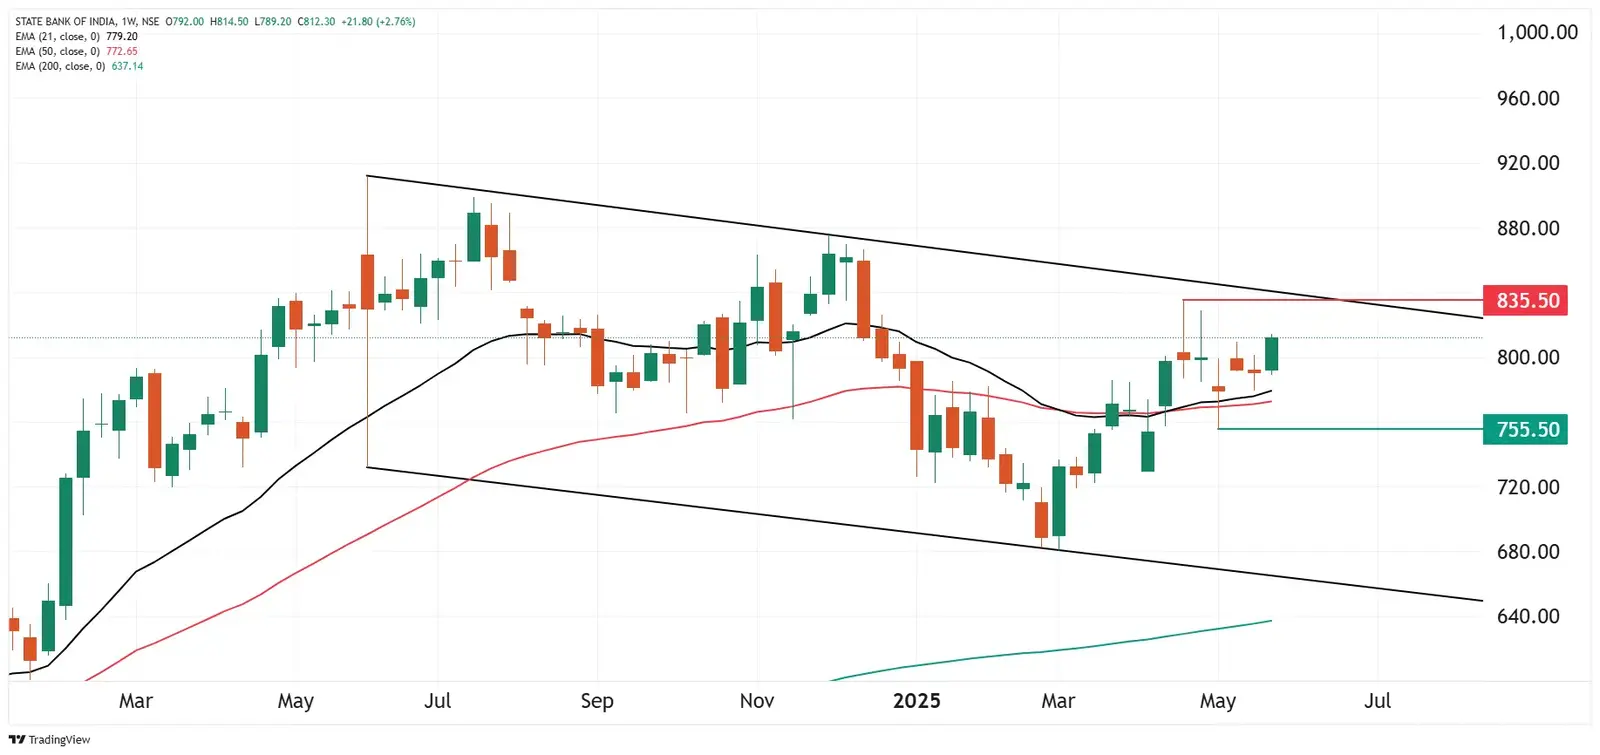
State Bank of India has crucial resistance zone of ₹835, while support for the stock remains at ₹755.
PSU bank stocks are in the spotlight this week. NIFTY PSU Bank index jumped over 2% intrday. The sector's benchmark index closed at a six-month high of 6,976 last week, rising by over 4%.
Shares of Bank of Maharashtra, Union Bank, Indian Overseas Bank, and UCO Bank rose between 3% and 6% intraday. According to experts, PSU bank stocks saw buying interest as many lenders declared better-than-expected results in the fourth quarter of FY25, while valuations remain in the comfort zone compared to the overall market.
Moreover, the widespread anticipation of the RBI cutting interest rates has also kept banking stocks on investors' radars. The central bank’s monetary policy committee is set to meet later this week to decide on the repo rate.
Banking stocks have also been in the spotlight after Moneycontrol reported that the Dubai-based Emirates NBD had offered $6–7 billion for a 61% stake in IDBI Bank in an all-cash deal.
Technical view
The NIFTY PSU Bank index formed a bullish candle on the weekly chart and has cleared the immediate hurdle of 6,850 on a closing basis. In our previous blog, we highlighted to our readers the breakout of the index from the falling wedge pattern connecting the swing highs of June 2024 and December 2024. Unless the index slips below the crucial support zone of 6,400, the trend may remain positive.
Stocks on radar
State Bank of India closed above the high of last two weeks and formed a bullish candle on the weekly chart. It is currently trading under the downward trending channel and is approaching the crucial resistance zone of ₹835. Meanwhile, the crucial support for the stock remains at ₹755. A break of this range on a closing basis will provide further directional clues.
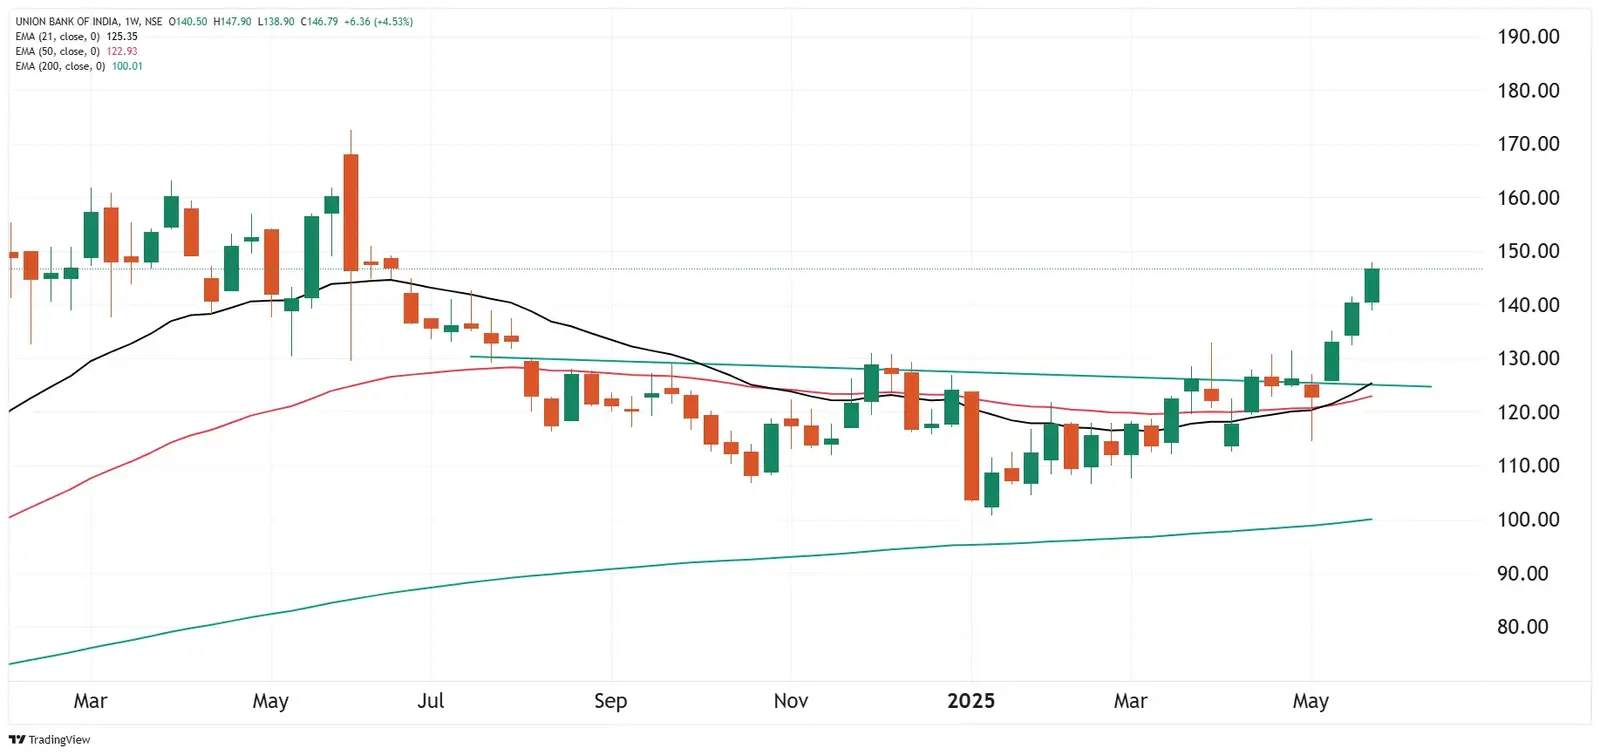
Union Bank of India sustained its bullish momentum for the third week in a row and has jumped over 16% in May. The stock has formed three bullish candles on the weekly chart, indicating strength. The immediate support for the stock is around ₹132 zone, while resistance remains around all-time high (₹172).
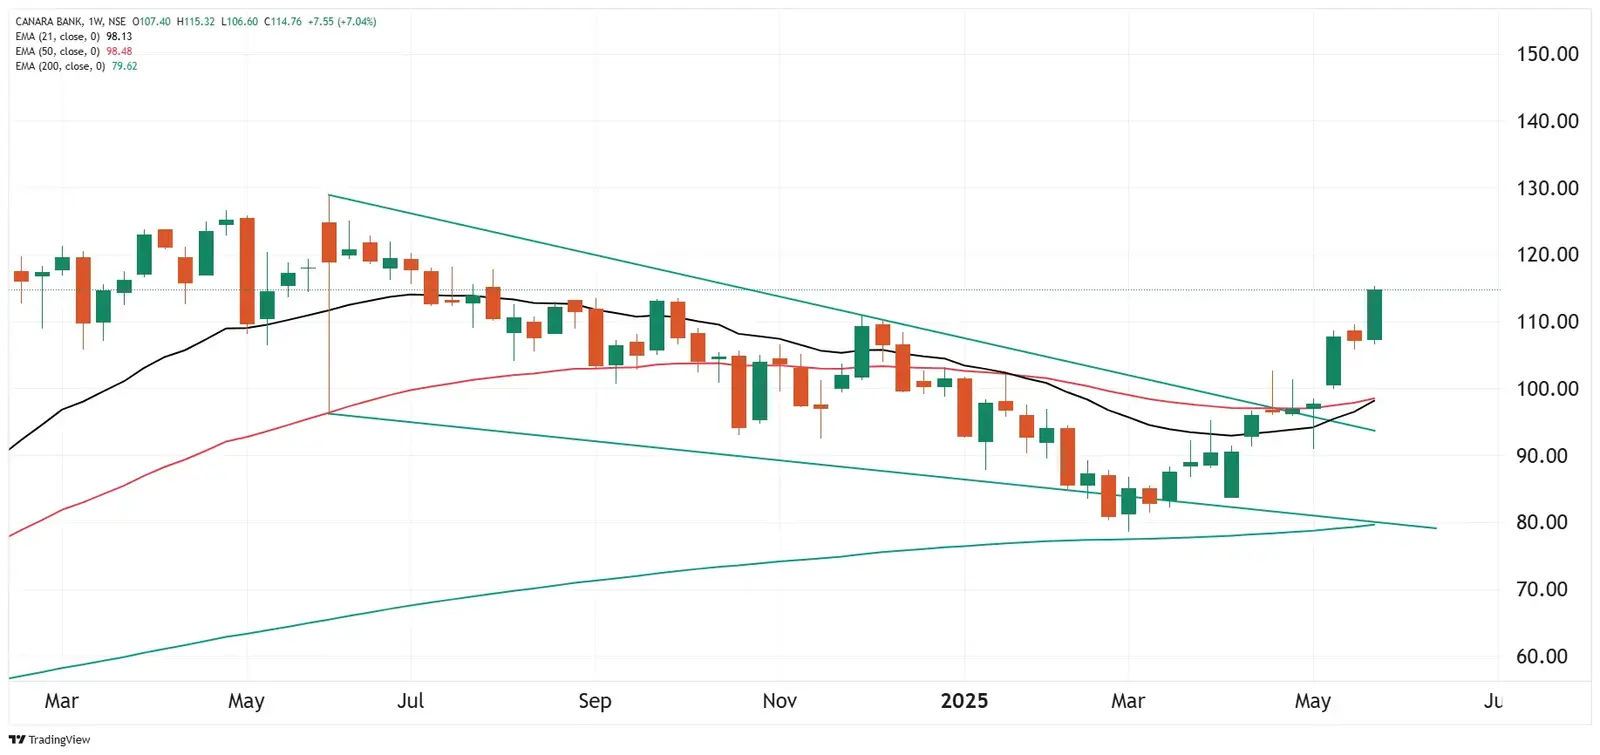
Canara Bank also extended its bullish momentum after a week’s pause and formed a bullish candle on the weekly chart. After reclaiming its 21-week and 50-week exponential moving averages and the breakout of falling wedge pattern, the stock has also captured the crucial resistance of ₹110 on a closing basis.
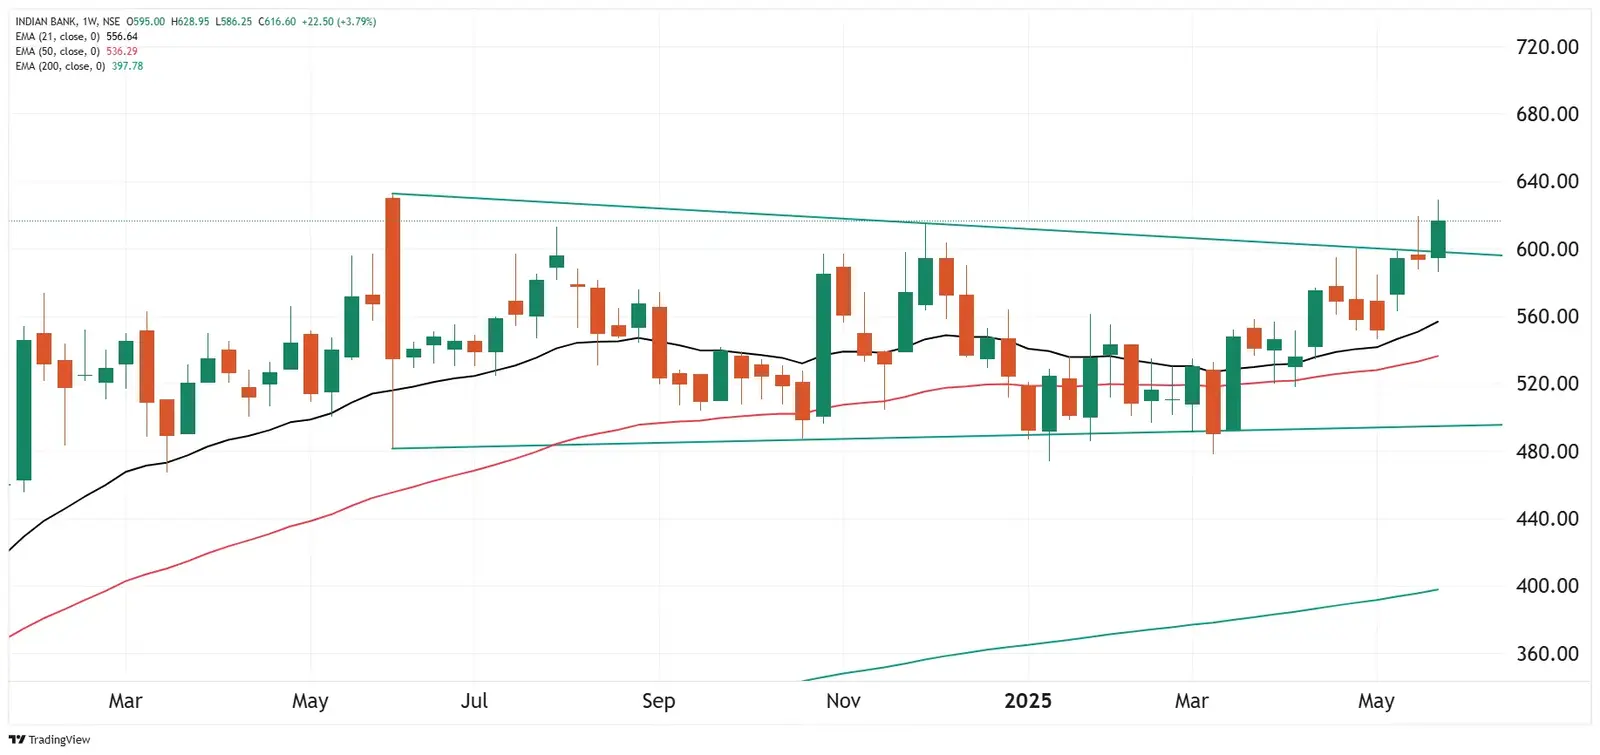
Indian Bank on the weekly chart invalidated the gravestone doji and moved past the symmetrical triangle pattern on the weekly chart. However, the stock faced resistance near its previous week’s high but has formed a bullish candle on the weekly chart. For the upcoming sessions, the immediate support for the stock is around ₹588, while resistance is around its all-time high (₹632).
Technical levels for SBI, Union Bank, Canara Bank
For example, let’s look at the options structure of State Bank of India (SBI) to understand the strategy.
The strategy involves buying an ATM call and selling a call option one strike above it. This implies the breakeven point of 815, which is 0.4% above Friday’s close. Meanwhile, the bull put spread involves selling the ATM put and buying a put option one strike below it.
About The Author
Next Story


