Market News
NSE IPO: How India's top exchange fare against global rivals

3 min read | Updated on September 17, 2026, 14:55 IST


SUMMARY
The company, which was established in 1992, now commands a monopoly position in India’s capital market with over a 90% share in the equity and derivatives segment. Alongside this, the company is also engaged in combined trading, clearing, settlement, listing, data, and market information services.
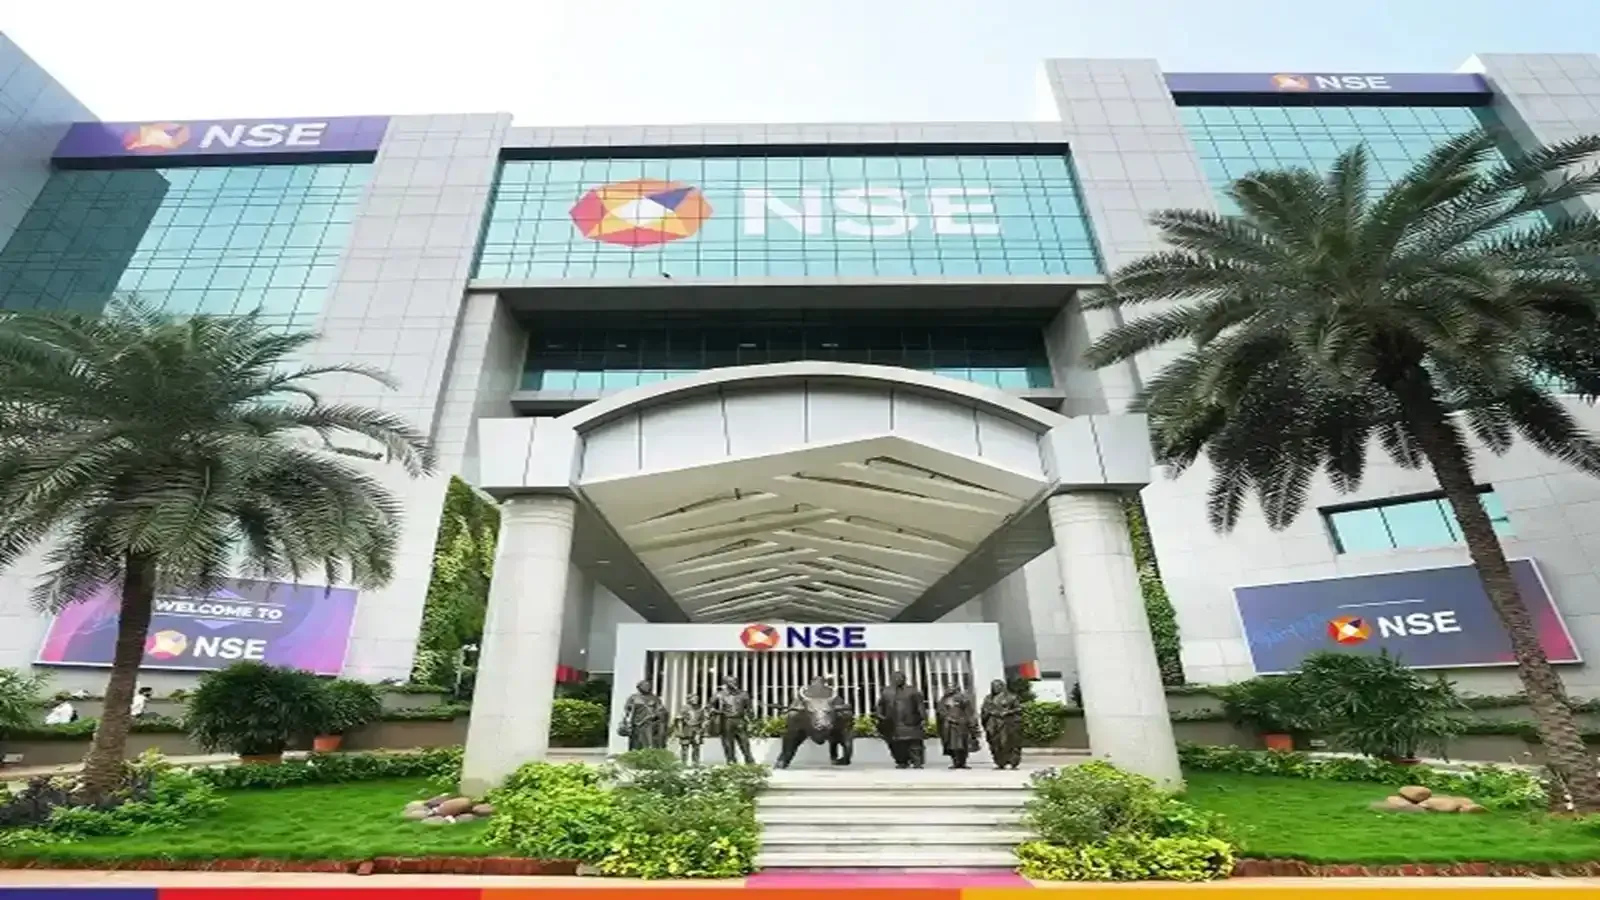
NSE held top position in terms of cash and derivatives contracts traded for the three months ending June, 2026. Image: Shutterstock.
NSE is about to hit the primary markets with its IPO starting Thursday, September 17. The IPO comes at a time when primary market activity has started buzzing again in H2 of 2026, after a dull H1 2026. The issue size stands at ₹22,561 crore, which is also an entirely offer-for-sale, with leading banks and insurance companies aiming to pare their stake in the country’s largest stock exchange. The issue price is set at ₹1,700 to ₹1,785 apiece, with the lot size of 8 shares per lot.
The company, which was established in 1992, now commands a monopoly position in India’s capital market with over a 90% share in the equity and derivatives segment. Alongside this, the company is also engaged in combined trading, clearing, settlement, listing, data, and market information services.
Besides this, NSE also ranks itself on the global charts in different parameters. Though India’s capital market holds a minuscule share in the global market capitalisation, NSE has found its space among the top ten global exchanges.
Global leader in derivative volumes
National Stock Exchange (NSE) is the global leader in the equity derivatives segment withthe highest number of contracts traded. As of FY26, 36.99 billion contracts were traded on the NSE’s derivatives segment, making it the leader in terms of total volumetradeds. India’s derivatives-to-cash market turnover ratio exceeds 400x as compared to 9-10x for the US, which is the largest capital market in the world. The majority of this volumes are traded on the NSE, indicating its significance at a global scale.
Top leader in cash equities volume
According to NSE’s RHP, NSE has also topped the charts in cash equities and contracts traded in derivatives volume in the three months ended June 2026 at 7.95 billion contracts. This was followed by NASDAQ at 5.9 billion, ICE at 5.35 billion, CBOE 4.64 billion, Japan Exchange group 1.56 billion. Not just the equity and derivative segment, Indian exchanges also topped the charts of IPO listings with 255 listings on the NSE and 219 at BSE as of FY26, followed by Hong Kong and NASDAQ at ~131 listings as of FY26.
Among the top 10 global exchanges
NSE also holds ~6th position in the global exchanges with market capitalisation of listed entities exceeding $5 trillion, just behind China, Europe and Japan. According to the data published by the World Federation of Exchanges, NASDAQ and NYSE together hold 46.5% of the total global market capitalisation. Followed by the Shanghai Stock Exchange and Japan Exchange Group.
Superior profitability
NSE is among the top exchanges that hold superior operating margins. The domestic exchange commands 7a 4.5% EBITDA margin as of FY26, which among the highest compared to its global peers. The superiority in operating profitability is primarily due to its traditional fees business model, which charges transaction costs on every trade on the exchange. Whereas other global exchanges have now shifted towards data service model, where they sell data to institutional players
Traditional vs Technology business model
NSE continues to rely on transaction charges as core revenue contributor as compared to global exchanges like LSEG and NASDAQ have transitioned themselves into technology companies. According to NSE’s RHP, transaction charges contribute more than 10% of the revenue for Indian exchanges, in line with global exchanges. However, Data feed, terminal services and index licensing and data subscription services contributed less than 5% of the total revenue for Indian exchanges, vs more than 10% for global exchanges.
Related News
About The Author
Next Story