Upstox Originals
What the Nifty-to-gold ratio is quietly telling us

3 min read | Updated on February 02, 2026, 15:19 IST


SUMMARY
With the recent sharp fall, gold prices are once again in the news. Investors are left wondering what their next steps should be. Meanwhile, equities haven’t exactly stepped up, with the Nifty trailing global peers and earnings not uniformly strong. At such times, in past cycles, investors have turned to the Nifty-to-gold ratio to gauge direction. What is the Nifty‑to‑gold ratio indicating currently? Read on

Gold prices have corrected almost 16% in the past week
Gold prices are in the spotlight again! Over the past two calendar years, gold has surged 92% (before the recent correction), while the Nifty 50 has risen just 19%. That gap says a lot about sentiment, where money has moved toward safety. But then, the last week has seen a sudden spike in volatility, with gold prices crashing almost 16%!
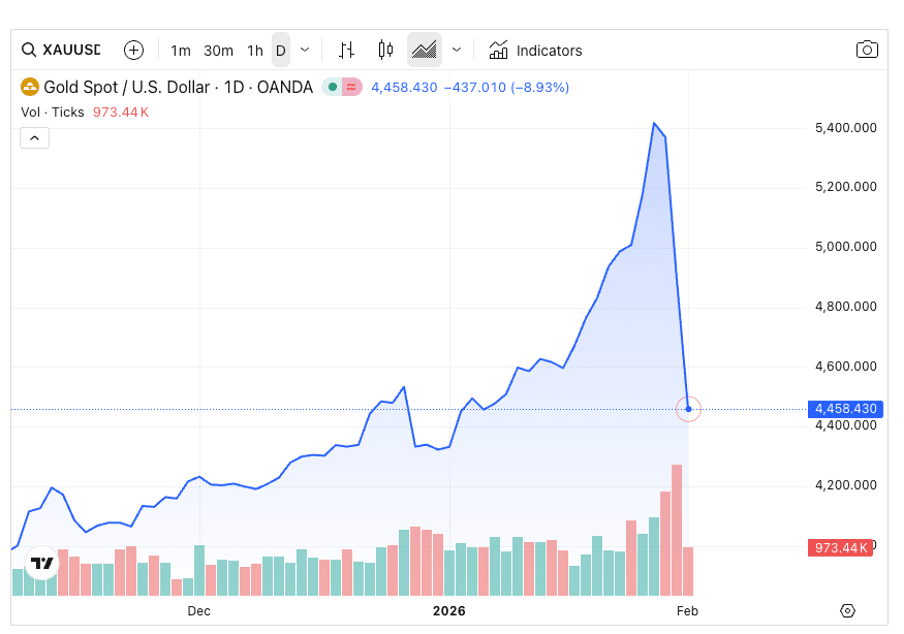
Source: Tradingview; *Data as of 01-02-26
Investors are now left in limbo – just a week back they were contemplating if gold prices were too high and what the next steps would be. In just a week, the questions have changed to - will this move persist, and should they sell? OR should they leverage this opportunity and increase their gold holdings? Gold is notoriously difficult to value, with no cash flows or earnings, further compounding its challenges.
Which is where the Nifty to gold ratio could provide some direction.
What is the Nifty-to-gold ratio?
It is a comparison between India’s equity benchmark and gold prices that quietly tracks how investors move between fear and conviction. And right now, that ratio is hovering near levels that, in the past, have often preceded strong market recoveries.
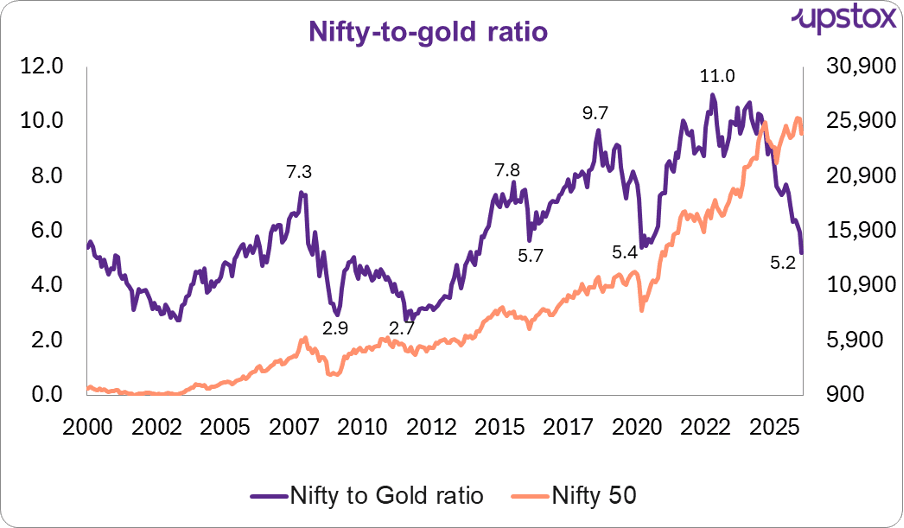
Source: Investing.com, *Data as of 01-02-26
When the ratio drops, it means gold is outperforming equities, a sign that investors are moving away from risk. It may also be less about fundamentals and more about sentiment. Investors might move money to gold not because profits have vanished, but because confidence could have.
| Previous bottom | Nifty return | Months |
|---|---|---|
| Jan-03 | 90% | 12 |
| Feb-09 | 137% | 21 |
| Aug-11 | 93% | 43 |
| Mar-20 | 147% | 19 |
Source: JM Financials
To a certain extent this finds further support in the recent market performance. The benchmak Nifty50 has been one of the lowest returning stock markets in the recent past. Infact, on a YTD basis, it has actually delivered negative returns.
| YTD return (%) | 1Y return (%) | 5Y returns (%) | |
|---|---|---|---|
| Nifty50 | (4.8) | 6.5 | 66.8 |
| Hang Seng | 1.2 | 31.8 | (8.8) |
| FTSE 100 | 2.7 | 19.1 | 57.6 |
| S&P 500 | 1.2 | 15.8 | 78.5 |
| Nikkei 225 | 1.6 | 36.7 | 82.9 |
| Bovespa (Brazil) | 12.9 | 43.9 | 50.8 |
| Taiwan Index | 7.8 | 39.4 | 100.1 |
Source: Google finance; *Data as of 02-02-26
So, buy equities?
Does this mean a rally is imminent and guaranteed? As always, the past is no guarantee of the future. The ratio helps map out investor sentiment and provides a caution signal for investors to take a step back and rethink their allocation. It absolutely should not be treated as a definitive guide.
Besides that, the market’s performance should be seen in concert with earnings growth.
Recent trends so far dont seem uniformly encouraging. Interim data shows that many results are only broadly in line with expectations, not spectacular. With macro challenges persisting, sustaimabilirty of these earnings remains a vital monitorable.
About The Author
Next Story

