Upstox Originals
U.S. markets at record highs: Strength or fragility?

5 min read | Updated on August 29, 2025, 10:28 IST


SUMMARY
The U.S. stock market is more expensive than at any point in modern history, even surpassing dot-com levels. While AI hype and mega-caps drive much of the surge, strong earnings in a few sectors are also giving valuations a cushion. History, however, suggests that when leadership is narrow, markets become more fragile, with important spillovers for India.

S&P500 is up almost 10% YTD in 2025
The U.S. stock market has crossed into uncharted territory — valuations are now higher than even the dot-com era. Investors are paying record prices for American equities, reflecting the power of mega-cap tech and the confidence around AI. But with history as a guide, such extremes always invite the same question: how long can it last?
The numbers behind the rise (or bubble?)
Buffet indicator
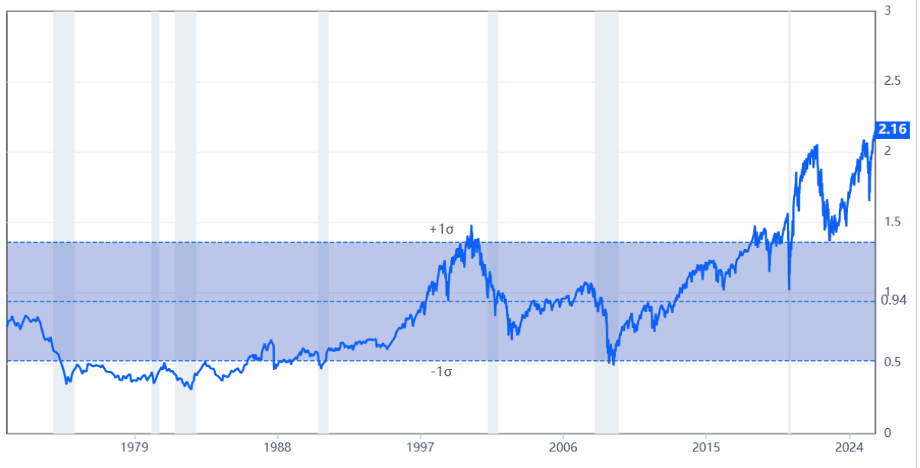
Source: Gurufocus
As shown in the chart, the current ratio stands over 2.15× GDP, marking the highest in decades and signaling ‘Significantly Overvalued’ territory. In simple terms, the Buffett Indicator compares the size of the stock market to the size of the economy, and at this level, it’s saying the market is running far hotter than the real economy beneath it.
For context, even during the dot-com bubble (1995-2001), this ratio peaked around 1.4× GDP, meaning today’s market is far more stretched than that era.
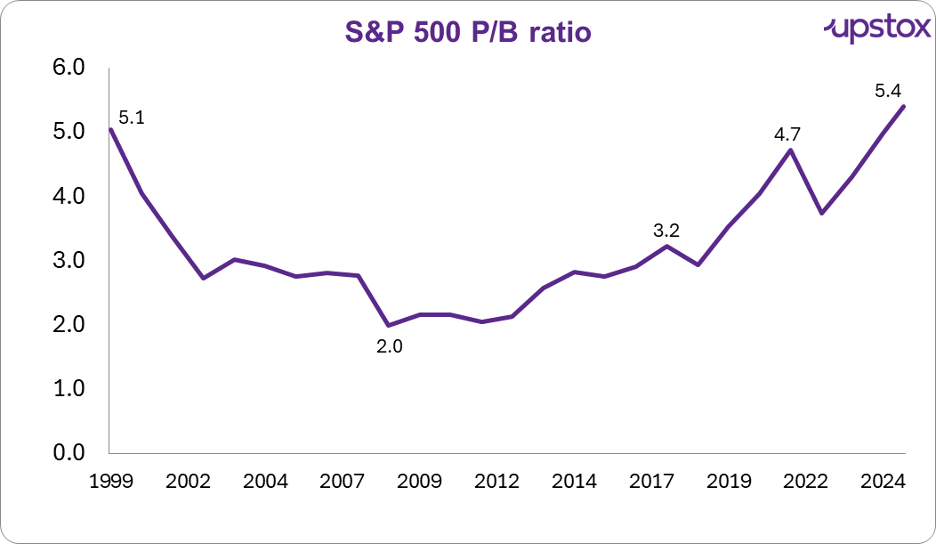
Source: multpl.com, Data as of 25-08-2025
The S&P 500’s P/B is around 5.3x, exceeding both its long-term average (~3.1x) and the dot-com peak of 5.1x.
S&P 500: Breaking past every historical peak
The chart below shows the rise of the S&P500 index. Since COVID-19, the index has almost doubled.
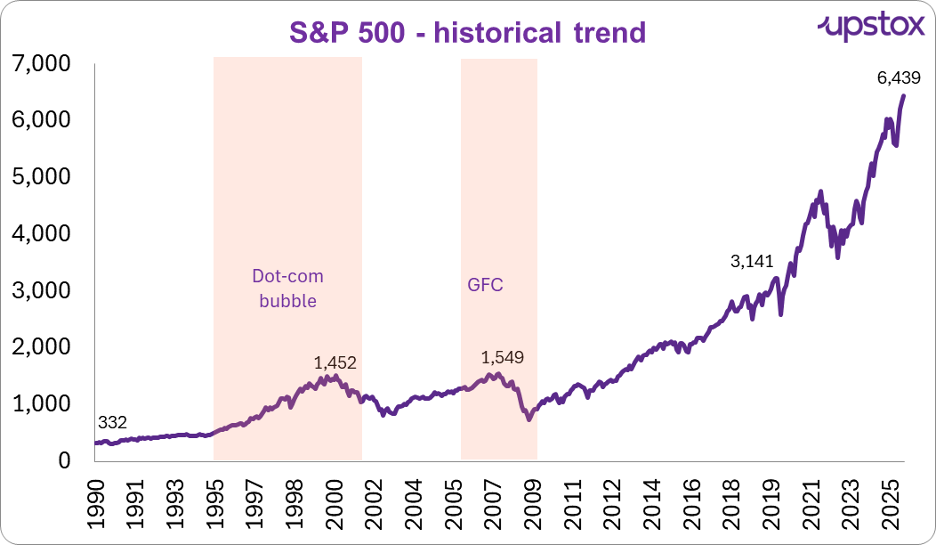
Source: Investing.com, Data as of 26-08-2025
Today’s level is more than 4× higher than those previous highs (around the GFC in 2008), reflecting both the strength of mega-cap tech and the intensity of investor optimism. But history reminds us, such steep climbs have often been followed by sharp corrections.
What is driving these valuations?
AI euphoria & the rise of the mega-caps
Artificial intelligence has become the market’s favourite buzzword, and nowhere is that clearer than in the dominance of the “Magnificent Seven.” Tech giants like Nvidia, Microsoft, and Apple have pulled the market higher, to the point where these three alone now make up 21% of the S&P 500 and over a quarter of the Nasdaq-100 ETF.
The impact is huge: Tech stocks are trading at nearly 10× sales, an 87% premium to their 10-year norm.
Earnings growth cushion
It’s not all froth, earnings are doing some heavy lifting too. In Q2 2025, S&P 500 companies delivered 11.8% YoY growth and 6.3% revenue growth, marking the third straight quarter of double-digit earnings gains. Importantly, 81% of companies beat both earnings and revenue estimates, well above their long-term averages.
Tech, communication services, and financials led the charge, showing that fundamentals have helped support the rally even as valuations stretch to record highs
Peak confidence, as if recession is impossible
Investors are acting like the U.S. economy is untouchable. Analysts call it “recession-proof thinking”, the belief that nothing can derail growth. That mindset is giving markets permission to pay higher and higher multiples without blinking.
Bond yields aren’t scaring anyone
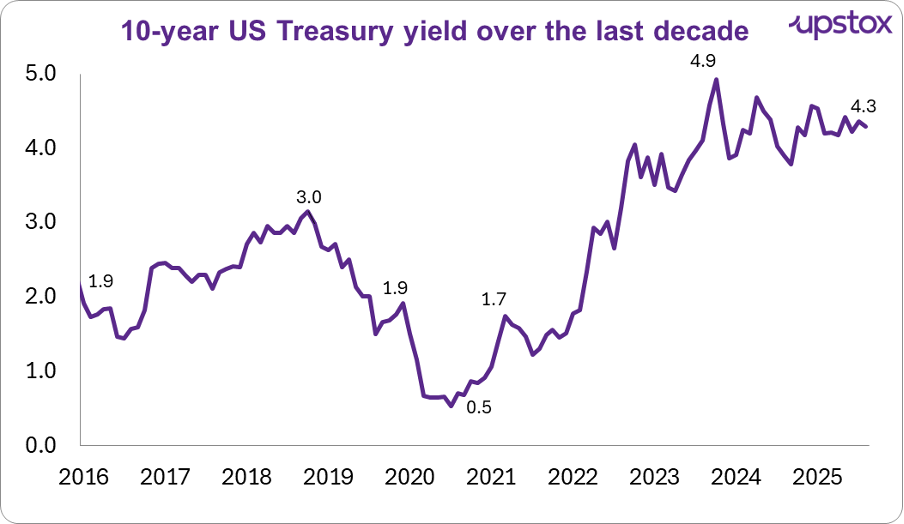
Source: Investing.com, Data as of 26-08-2025
Over the past decade, the U.S. 10-year Treasury yield has risen from 0.5% in 2020 to over 4% in 2025, even touching 4.9% at one point. Normally, such a sharp increase would cool equities by making bonds more attractive, but this cycle has been different.
Despite higher yields, stock investments have continued to pour in, showing just how strong investor appetite for equities remains. The old “TINA” mantra (There Is No Alternative) may be fading, but risk-taking is clearly alive and well.
What can we learn from history, and why is it important for India?
History would indicate that when valuations are this extreme, there are some corrections in store. There is a variable this time: uneven earnings strength. Tech, communication services, and financials are delivering robust double-digit returns while other sectors like energy, utilities, and some industries lag behind.
That is reminiscent of the dot-com bubble when a few stalwarts in technology held up the economy amid a less robust overall story in earnings. At year-end 2021, the Buffett Indicator reached about 2.06× GDP levels around today's 2.15×. That was followed by a 2022 correction when the S&P 500 declined some 20% amid a gathering inflation scare and steeply increased interest rates.
The takeaway isn’t that every rally ends in steep fall; it’s that when only a handful of stocks carry the market, the risks of a sharp reset rise For Indian investors, U.S. market swings aren’t just distant events, they directly affect domestic markets:
-
Capital flows: A U.S. correction can trigger foreign portfolio outflows from India, weighing on equity benchmarks.
-
Currency impact: Heavy outflows tend to pressure the rupee, raising import costs and inflation risks.
-
Opportunity side: Over the medium term, expensive U.S. valuations could make investors look harder at emerging markets like India, which still offer stronger structural growth stories.
How does Wall Street’s surge look when stacked against other markets? Here’s a quick snapshot of year-to-date performance across major indices:-
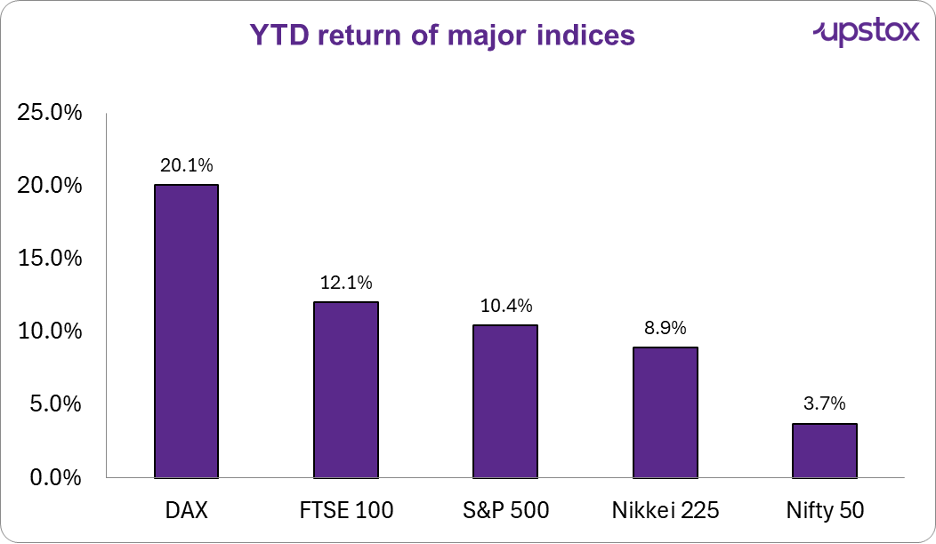
Source: Google finance, data as of 28-08-2025
Outlook
Looking ahead, U.S. markets sit at an inflection point. On the upside, resilient earnings in tech and financials offer some support for today's high valuations. On the downside, concerns like persistent inflation, a probability of higher-for-longer interest rates, and ongoing geopolitical tensions could quickly test investor confidence.
For India and other emerging markets, that means staying alert to short-term shocks if Wall Street wobbles, but also being poised to capitalise on long-term opportunities should global capital begin to shift away from expensive U.S. equities.
About The Author
Next Story

