Upstox Originals
What does technical analysis say about NIFTY 100 and NIFTY Midcap 150?
.png)
3 min read | Updated on May 31, 2024, 16:30 IST


SUMMARY
The ratio of NIFTY 100 to NIFTY Midcap 150 is trading at its decadal low. What does it mean for the traders and investors? In this article, we take a “technical” look at the indices to evaluate the current underlying trends.

Foreign investor selling and pre-election jitters are likely culprits for market fall.
Before we delve into the technical parameters of evaluating these indices, let us understand what the NIFTY 100 to NIFTY Midcap 150 ratio indicates.
The NIFTY 100 to NIFTY Midcap 150 ratio is derived by dividing the index value of NIFTY 100 by NIFTY Midcap 150. Investors can use this as one of the metrics to judge market trends and make investing decisions.
This ratio is currently near its decadal low of 1.23. The median, however, is 1.74. In the last decade, it was the highest at 2.37 in 2018. Further, the ratio has mostly stayed between 1.5 and 2.0 for a significant period.
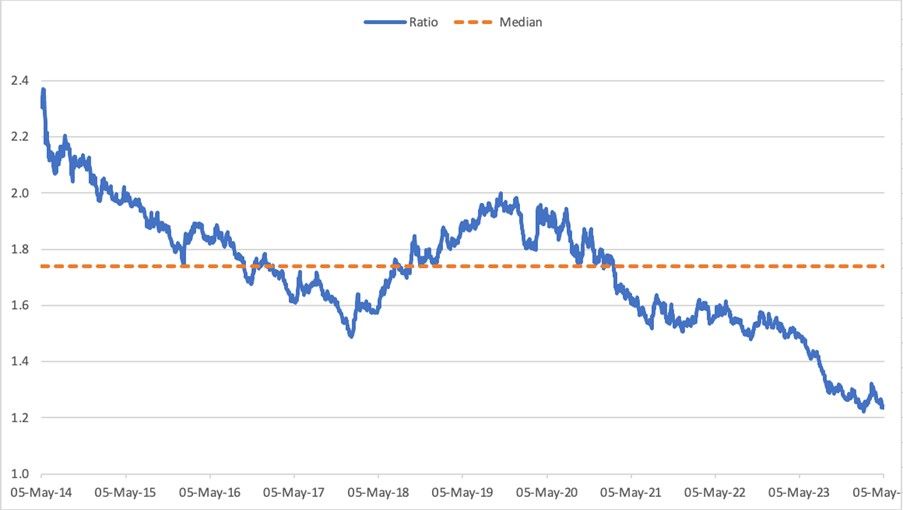
Source: NSE, NIFTY 50 and NIFTY Midcap 150 Analysis.xlsx
What does it mean for the investors? The NIFTY Midcap 150 index has far outperformed the NIFTY 100 index. It can mean either of these things for investors:
- NIFTY 100 index is undervalued, or
- Nifty Midcap 150 index is overvalued
Let us independently review the technical parameters of the two indices.
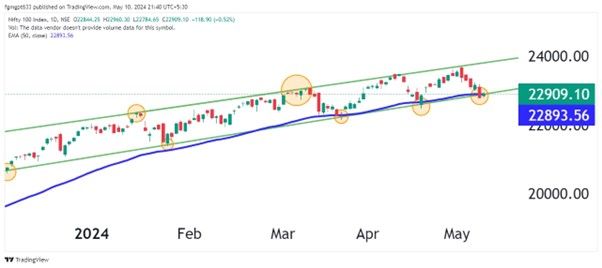
Source: TradingView
The index has been trending within an ascending channel since December 2023. The lower trend line of the channel has consistently acted as strong support, with the price touching and rebounding from this line several times, as indicated by the circles. The upper trend line represents the resistance level, which has repeatedly capped the price rallies.
The blue line represents the 50-day Exponential Moving Average (EMA), which currently stands at 22,893. This moving average is crucial, as it acts as a dynamic level of support for the index.
Recently, the price has experienced a slight downturn and is approaching the lower boundary of the ascending channel. This is a crucial area to watch, as a breach below this level could indicate a potential downtrend. However, on the contrary, the index may bounce up if this support is held.
Simply put - our analysis indicates that the NIFTY 100 index has bullish momentum.
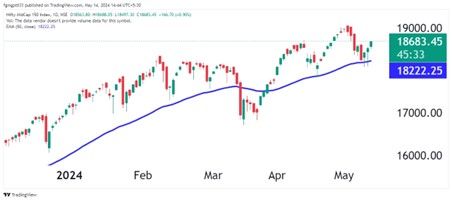
Source: TradingView
The NIFTY Midcap 150 Index has experienced a noticeable uptrend from December 2023 onwards. Also, it recently took support at its 50-day EMA and pulled back from there.
The 50-day EMA has closely followed the price and provided support on multiple occasions. Most recently, in April 2024 and May 2024, the index dipped but found strong support at the 50-day EMA before rebounding.
If the index sustains above the 50-day EMA, we could see an attempt to retest this high. Conversely, a break below the EMA could signal a deeper correction.
Simply put, our analysis indicates that the NIFTY Midcap 150 index is also in bullish territory.
Conclusion
The bullish technical momentum on both indices is encouraging. The trend in the NIFTY Midcap 150 to NIFTY 100 ratio, coupled with our findings of NIFTY Midcap overvaluation in decoding valuations, suggests that the NIFTY could have an upper edge.
About The Author
Next Story

