Personal Finance News
HDFC vs ICICI vs Parag Parikh vs Mirae: Are India’s leading flexi-cap mutual funds really the same?

7 min read | Updated on April 23, 2026, 07:25 IST


SUMMARY
Are India’s leading flexi-cap mutual funds really the same? When you actually break them down, the way they take risks, generate returns, and behave across market cycles, they are very different. And that is the reason why investors need to look beyond just returns.

Calling all flexi-cap mutual funds “similar” doesn’t really do justice to how differently they operate. | Image: Shutterstock.
On paper, most of India’s leading flexi-cap mutual funds look quite similar. Same category, similar benchmarks, and all promising the flexibility to move across large, mid, and small-caps.
But when you actually break them down, the way they take risks, generate returns, and behave across market cycles, they are very different.
And that is the reason why investors need to look beyond just returns.
This becomes even more relevant when you look at where investor money is flowing. In March, equity mutual funds saw a sharp jump in inflows to ₹40,450 crore, up from about ₹25,977 crore in February, the highest since July 2025.
What should investors actually compare?
-
Assets Under Management (AUM): It reflects investors' trust.
-
Fama ratio: This shows if the fund is outperforming
-
Beta: This shows how aggressive the fund is vs the market
-
Standard Deviation: This shows how volatile the fund is
-
Sharpe Ratio: This will give you an idea of how well the fund compensates for the risk it takes
-
Fund Manager: This is often the most underrated factor
One important thing to note here is how we have chosen these funds for comparison. Instead of randomly picking schemes, we have focused on the top flexi-cap funds based on AUM.
Before reading further, please note that this is just for informational purposes only and not intended to recommend any of the schemes mentioned below. You should make an investment decision based on your personal financial goals and risk appetite.
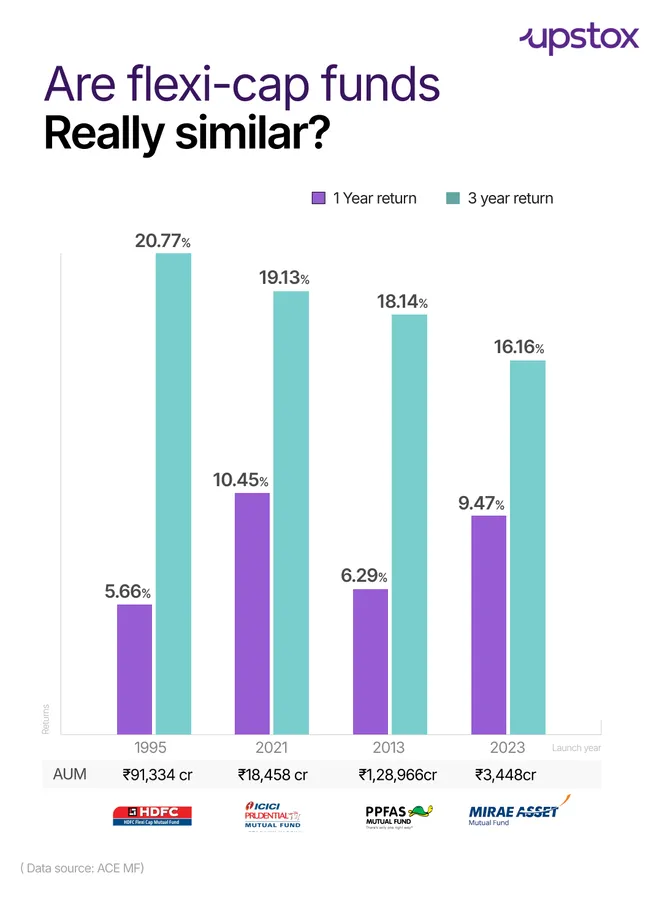
For this analysis, we have selected four such funds. These are HDFC Flexi Cap Fund, ICICI Prudential Flexi Cap Fund, Parag Parikh Flexi Cap Fund, and Mirae Asset Flexi Cap Fund.
HDFC Flexi Cap Fund
Its beta is around 0.82, which means it takes slightly less risk than the market, and its standard deviation of 0.77 suggests relatively controlled volatility.
Interestingly, its Fama ratio is slightly negative at -0.01, and Sharpe is modest at 0.02. What does this ratio tell you about this fund? It tells you that the fund is not aggressively chasing excess returns.
Over time, HDFC Flexi Cap Fund has quietly delivered, beating its benchmark over both 3 and 5 years. It may not always shine in the short term, but it tends to hold its ground over longer periods.
ICICI Prudential Flexi Cap Fund
Its beta sits at 1.02, so it moves more or less in line with the market, sometimes even a bit more aggressively. The standard deviation is higher, too, at 0.94, which means investors should expect more ups and downs.
But that risk has paid off recently; the fund has delivered strong returns, especially over the past year.
Its Fama ratio of 0.02 and Sharpe of 0.04 (the highest among these peers) suggest that it has been able to generate better risk-adjusted returns, at least in the current cycle.
Parag Parikh Flexi Cap Fund
It doesn’t swing as much with the market, which many investors find comforting.
Its Fama is neutral at 0.00, and Sharpe is around 0.03, so it’s not about aggressive outperformance.
Yet, despite taking lower risk, it has still managed to beat its benchmark over 3 and 5 years. That consistency, combined with its large AUM of over ₹1.28 lakh crore, shows the kind of trust it has built over time.
Mirae Asset Flexi Cap Fund
Its numbers place it somewhere in between; it has a beta of 0.95, a standard deviation of 0.87, a Fama of 0.01, and a Sharpe of 0.03.
So it’s neither too aggressive nor too conservative. Early performance looks decent, with some outperformance in the 1-year, but it’s still too soon to say how it will behave across full market cycles.
| Fund | Fund Manager | AUM (₹ crore) | Launch Year | Fama | Beta | Std. Dev. | Sharpe | 1 Year Return | 3 Year Return | 5 Year Return |
|---|---|---|---|---|---|---|---|---|---|---|
| HDFC Flexi Cap Fund | Amit Ganatra | 91,334 | 1995 | -0.01 | 0.82 | 0.77 | 0.02 | 5.66% | 20.77% | 20.87% |
| ICICI Prudential Flexi Cap Fund | Rajat Chandak | 18,458 | 2021 | 0.02 | 1.02 | 0.94 | 0.04 | 10.45% | 19.13% | — |
| Parag Parikh Flexi Cap Fund | Rajeev Thakkar | 1,28,966 | 2013 | 0.00 | 0.56 | 0.57 | 0.03 | 6.29% | 18.14% | 16.39% |
| Mirae Asset Flexi Cap Fund | Varun Goel | 3,448 | 2023 | 0.01 | 0.95 | 0.87 | 0.03 | 9.47% | 16.16% | — |
( Data source: ACE MF)
So are they actually the same?
When you put all of this together, it becomes clear that calling all flexi-cap funds “similar” doesn’t really do justice to how differently they operate.
Some focus on stability and long-term consistency, some are willing to take higher risks for better returns, and others try to strike a balance.
HDFC leans towards steady, long-term consistency rather than chasing quick wins.
ICICI Prudential, on the other hand, takes a more aggressive approach in search of higher returns.
Parag Parikh stands out for its focus on lower risk and a more stable investing experience.
And Mirae Asset, being relatively new, is still evolving and shaping its approach over time.
Therefore, the correct question to ask is not, "Which fund gave the highest return?" but rather: "Is the risk style of this fund appropriate for my level of investment?"
Key mutual fund metrics explained
This tells you how closely your fund moves with the market.
Beta = 1: The fund moves just like the market
Beta > 1: The fund is more volatile than the market
Beta < 1: The fund is less volatile
Standard deviation shows how much a fund’s returns go up and down.
A high standard deviation means the fund can swing sharply
A low standard deviation means the returns are smoother and more predictable
Positive Fama: The manager has performed better than expected
Negative Fama: The fund hasn’t lived up to expectations
The Sharpe ratio tells you whether the return you are getting is worth the risk you are taking.
A higher Sharpe ratio means better returns for each unit of risk.
Related News


About The Author
Next Story
