Market News
Week ahead: Q1 earnings, India-U.S. trade deal, Inflation print and FII flows in focus
.png)
6 min read | Updated on July 13, 2025, 12:16 IST


SUMMARY
In the coming week, market trends will be shaped by the earnings of HCL Tech, Wipro, Reliance and HDFC Bank, as well as inflation data and any announcements regarding the U.S.-India trade deal. From a technical perspective, the NIFTY50 index has a crucial support zone at 25,000. A close below this zone and the 50-day EMA could lead to further weakness.

NIFTY50 and SENSEX closed 1.2% lower for the week. Image source: Shutterstock.
Indian markets continued their losing streak, slipping below key support levels as uncertainty surrounding U.S. tariffs and weak IT earnings dampened investor sentiment. Selling pressure intensified towards the end of the week after U.S. President Donald Trump announced plans for widespread tariffs of 15–20% on major trading partners, igniting global trade concerns. The headline NIFTY50 index formed a bearish candle and ended the week at 25,149, down 1.2%.
The broader markets also faced selling pressure amid uncertainty, with NIFTY Midcap 150 index declining 1.5% and the Smallcap 250 index ending the week down 0.6%. Sectorally, except for FMCG and Private Banks , all the major indices ended the week in the red. Defence, IT and Consumer Durables faced significant selling pressure.
Index breadth
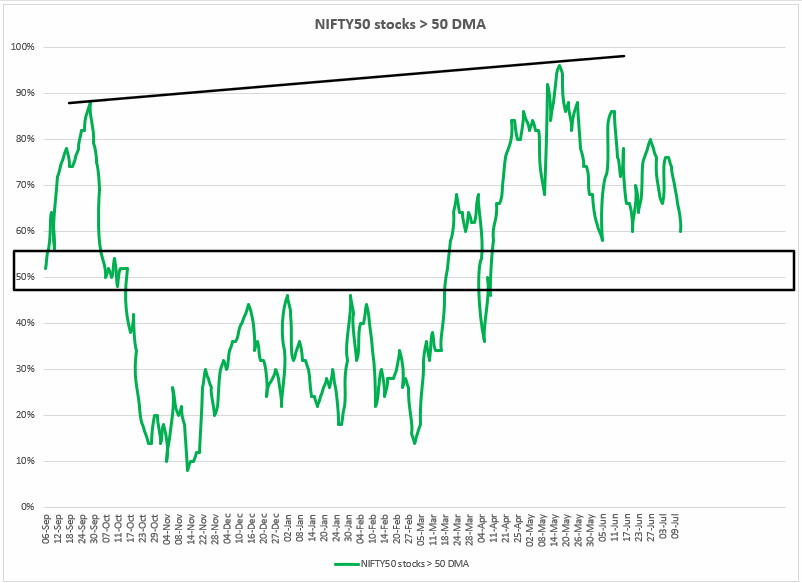
The NIFTY50’s breadth weakened over the week, with only 60% of its stocks holding above their 50-day moving averages, down from 76% at the start. This steady decline indicates increasing weakness in the index.
Since peaking at 96% in May 2025, the breadth has steadily eroded, now approaching a key threshold. Traders should watch for a move below the 50% mark, which, as we've noted in earlier posts, would be an early sign of deeper market weakness.
FIIs positioning in the index
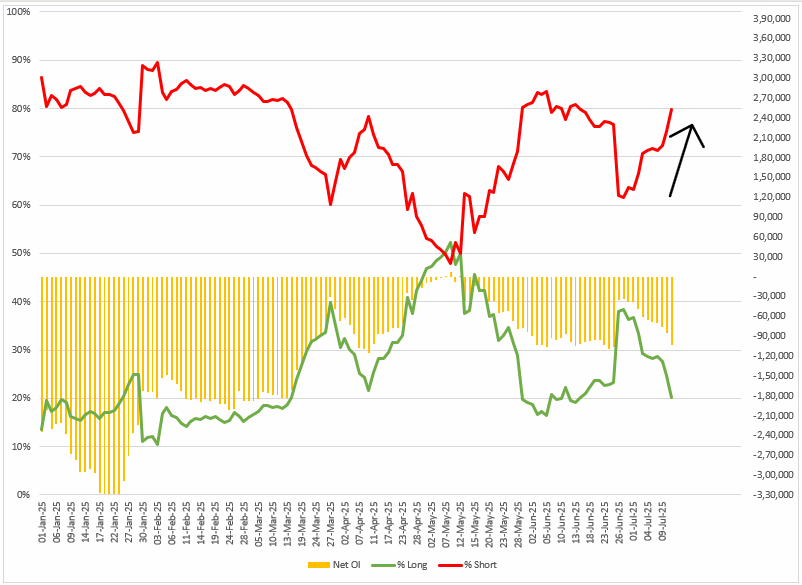
Foreign Institutional Investors (FIIs) increased their bearish bets on index futures further, moving the long-to-short ratio to 20:80. This means that over 80% of FIIs' open interest in index futures is in short contracts, with net open interest standing at -1.3 lakh contracts,up 58% from last week. They gradually increased the bearish bets on weekly expiry of NIFTY50’s options contract and a day after.
In the cash market, FIIs turned net sellers last week, offloading shares worth ₹4,076 crore. The majority of this figure was offloaded on 11 July. Meanwhile, Domestic Investors supported the markets, remaining net buyers and purchasing shares worth ₹7,570 crore.
NIFTY50
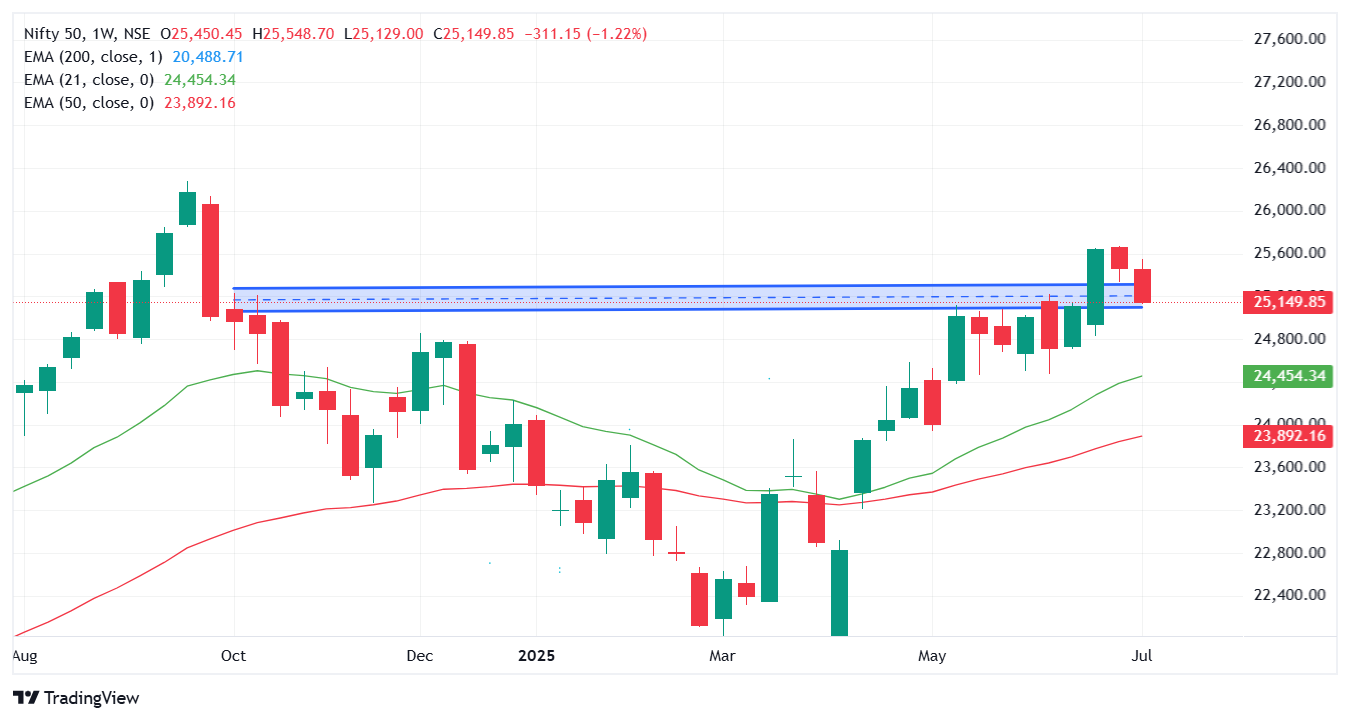
The NIFTY50 index formed a bearish candle on the weekly chart and closed the week below previous week’s low, indicating weakness. However, the index has now approached the crucial support zone of 25,000, which it reclaimed in June after breaking out from five-weeks consolidation.
In the coming week, traders can monitor the price action of the index around the 25,000 zone. A decisive close below this zone will signal further downside, while a bounce backed by a reversal pattern will signal continuation of the uptrend.
NIFTY IT
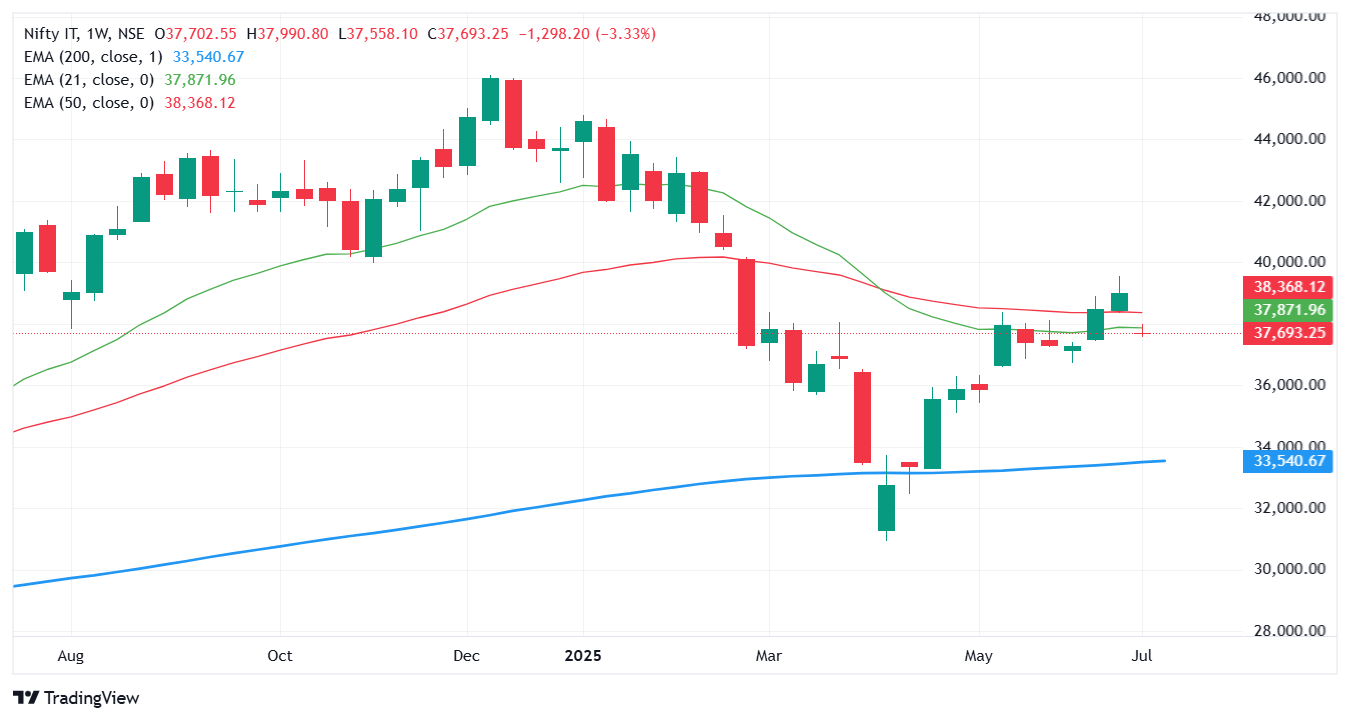
The NIFTYIT Index fell more than 3%, forming a bearish candle on the weekly chart. The index also fell below its key 21-week and 50-week exponential moving averages, suggesting weakness. The sharp fall was due to weak Q1 results from TCS, as well as broader concerns around revenue growth across the sector.
Meanwhile, on the domestic front, all eyes will be on the retail inflation (CPI) and wholesale inflation (WPI) data for June, which is set to be released on Monday. In May, India’s CPI reading eased to 2.8%, down from 3.1% in April, the lowest level since February 2019.
Adding to the uncertainty, oil prices also remained high amid growing uncertainty over a potential trade war, as Trump sent letters to over two dozen key allies and trade partners, including Canada, Japan, South Korea and Brazil, raising concerns about possible blanket tariffs. Meanwhile, the European Union is still awaiting clarity from the White House on its stance on trade.
In the sessions ahead, traders should closely watch price action around the 21-day EMA and the 25,000 mark. A sustained close below this support could open the door for a deeper correction toward the 50-day EMA. On the flip side, if the index holds above 25,000, it may signal strength and set the stage for a rebound.
Derivatives trading must be done only by traders who fully understand the risks associated with them and strictly apply risk mechanisms like stop-losses. The information is only for consumption by the client, and such material should not be redistributed. We do not recommend any particular stock, securities, or trading strategies. The securities quoted are exemplary and not recommendatory. The stock names mentioned in this article are purely to show how to do analysis. Make your own decision before investing.
About The Author
Next Story


