Market News
Week ahead: Fed minutes, auto sales numbers, FII activity among key factors to watch this week
.png)
7 min read | Updated on July 01, 2024, 08:36 IST


SUMMARY
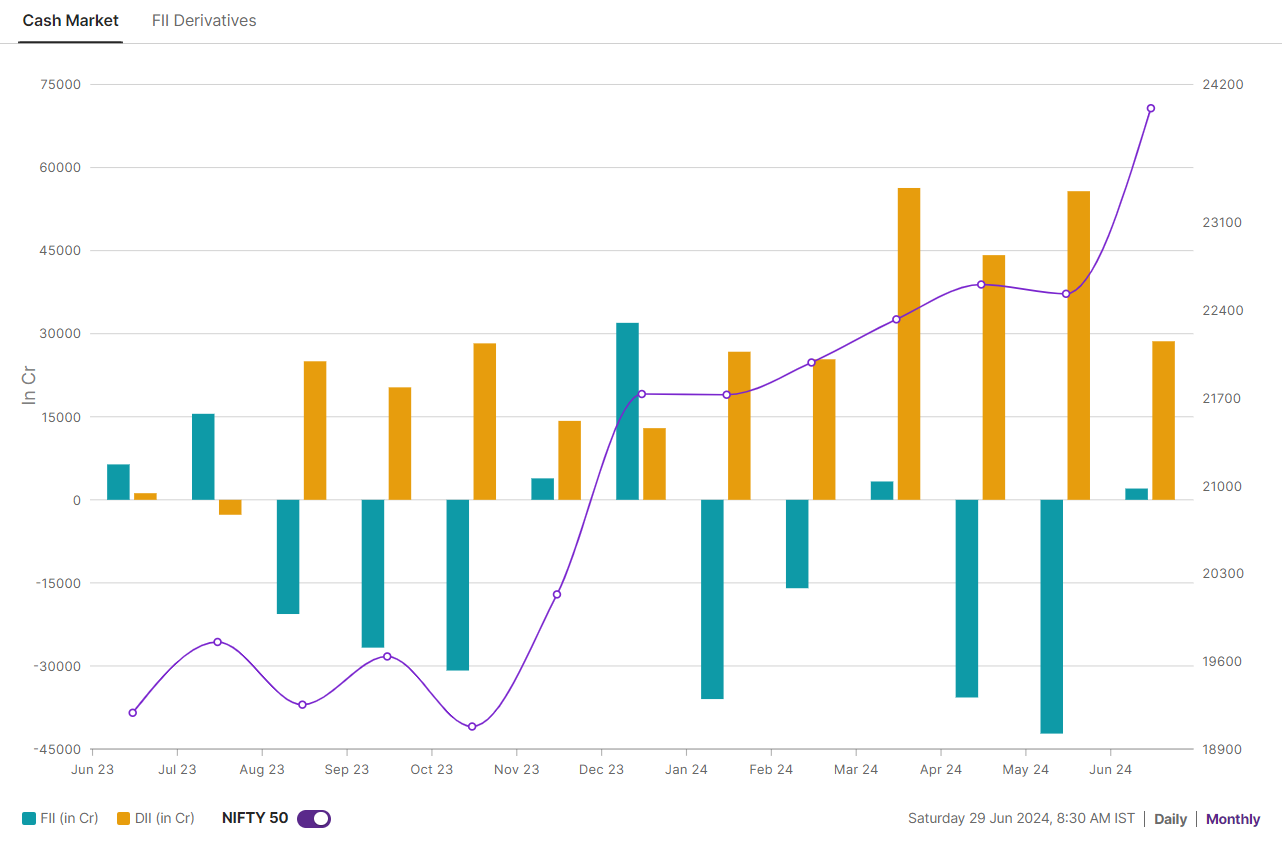
After selling shares worth ₹77,906 crore in April and May, Foreign Institutional Investors (FIIs) ended their selling spree in June and bought shares worth ₹2,037 crore on a net basis. However, it remains to be seen whether this buying trend will continue or whether it was just a temporary pause ahead of the Union Budget announcement.
Key triggers for markets this week include auto sales numbers, FIIs activity, Fed minutes
Markets extended the winning streak for the fourth-week in a row and ended the week in the green. The NIFTY50 index gained over 2% and closed above the psychologically important 24,000 mark.
The sharp rally on the indices was led by Oil & Gas (+3.0%) and IT (+2.7%) pack, while the Metals (-1.7%) and PSU Banks (-0.2%) witnessed profit-booking.
The broader indices also extended the winning momentum for the fourth consecutive week. The NIFTY Midcap 100 index gained 0.5%, while the Smallcap 100 index advanced 0.4%.
Also read: Trade setup for 1 July: Asian markets trade flat, Bank NIFTY to face resistance at 53,000
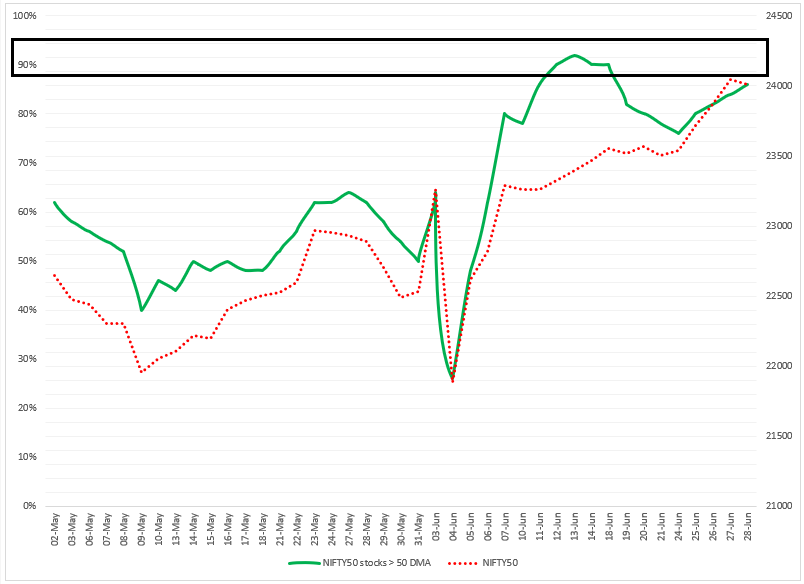
Index breadth- NIFTY50
Currently, 84% of the NIFTY50 stocks are trading above their 50-day moving average (DMA), up from 78% last week. In last week's blog, we advised our readers that the NIFTY50 was indeed consolidating gains at higher levels and that a break of the previous week's high and low of the doji candle would provide further directional clues.
Looking ahead to next week, the breadth indicator (NIFTY50 stocks trading above the 50 DMA) is positioned at the higher levels. The broader trend of the index remains positive, but after a strong rally, traders should remain cautious about taking profits at higher levels and expect range-bound activity in the near term.
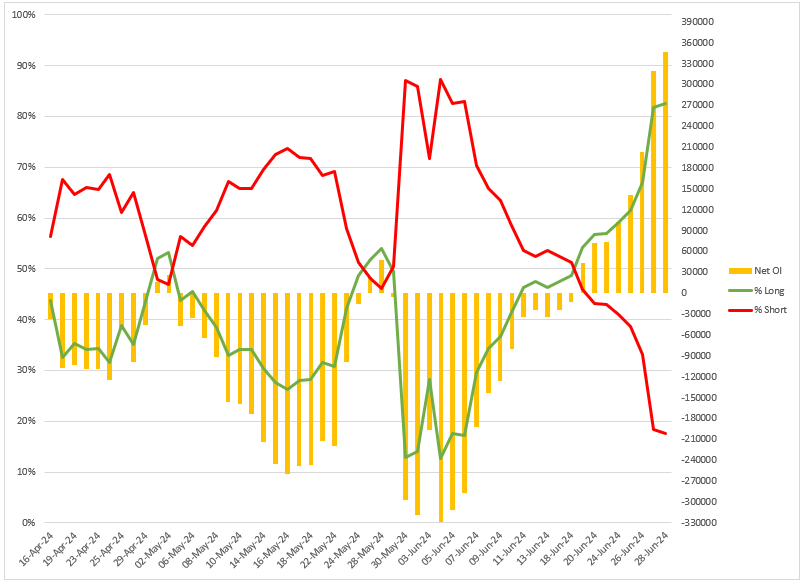
FIIs positioning in the index
Following the expiry of the June futures and options contracts, the current net open interest (OI) of Foreign Institutional Investors (FIIs) in the index futures is 3,46,883 contracts. This means that FIIs have started the July series with a long-to-short ratio of 83:17.
In last week's analysis, we highlighted for our readers the crossover of the net long contracts (marked in green) with the net short contracts on the 21st. As shown in the chart below, FIIs continued to add long futures contracts after the crossover, taking the net long OI from 57% to 83%. This led to a sharp rally in the NIFTY50 index, which helped it cross the 24,000 level on the day of the June monthly expiry.
The significant long contracts in the index futures were in tandem with FII activity in the cash market. After offloading shares worth ₹77,906 crore in April and May, FIIs turned net buyers in June, buying shares worth ₹2,037 crore. Meanwhile, Domestic Institutional Investors remained net buyers for the eleventh consecutive month, buying shares worth ₹28,633 crore.
F&O - NIFTY50 outlook
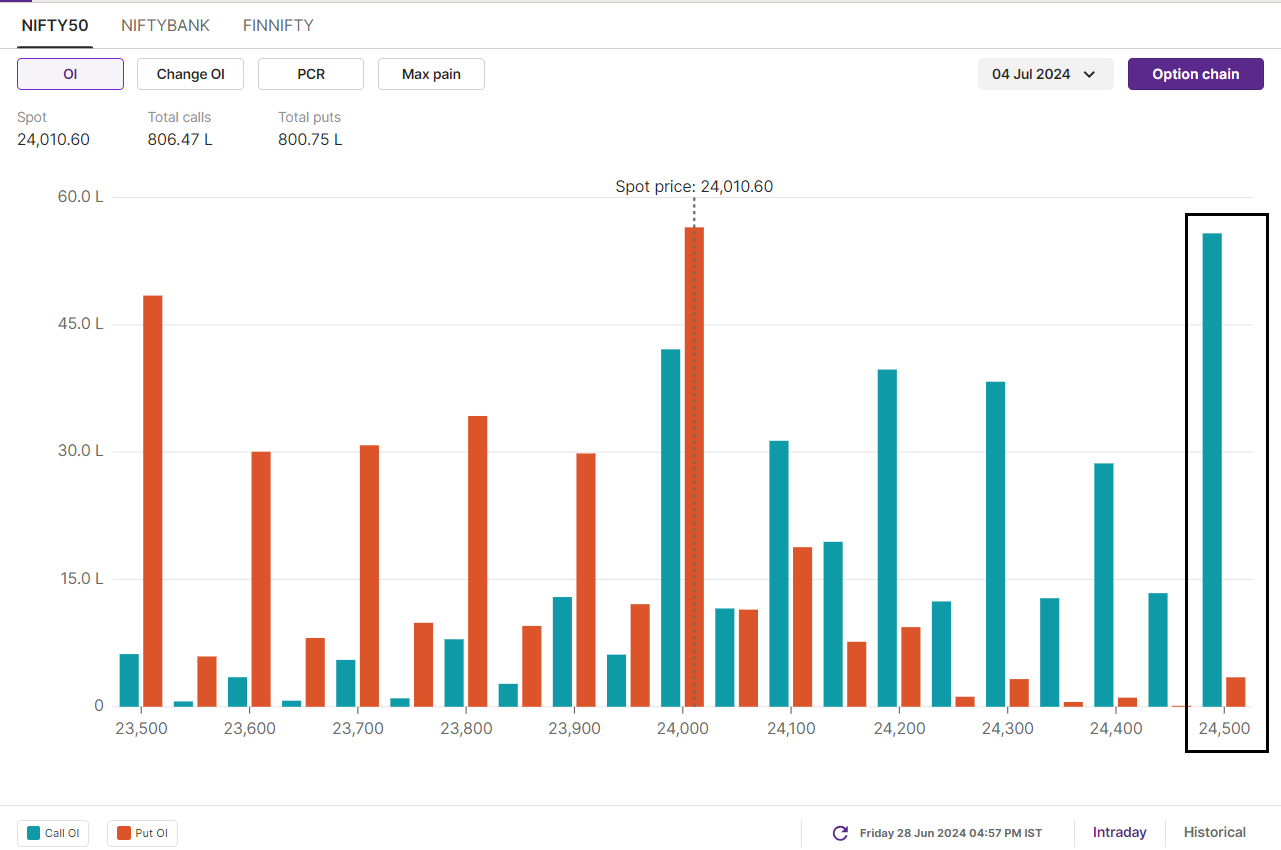
The NIFTY50 index saw significant call open interest placed at 24,500 strike, indicating it as a resistance zone for the 4 July expiry. Meanwhile, the put base is established at 24,000 and 23,500 strike, highlighting support around these zones. Based on the options data, traders are expecting NIFTY50 to trade between 23,700 and 24,600.
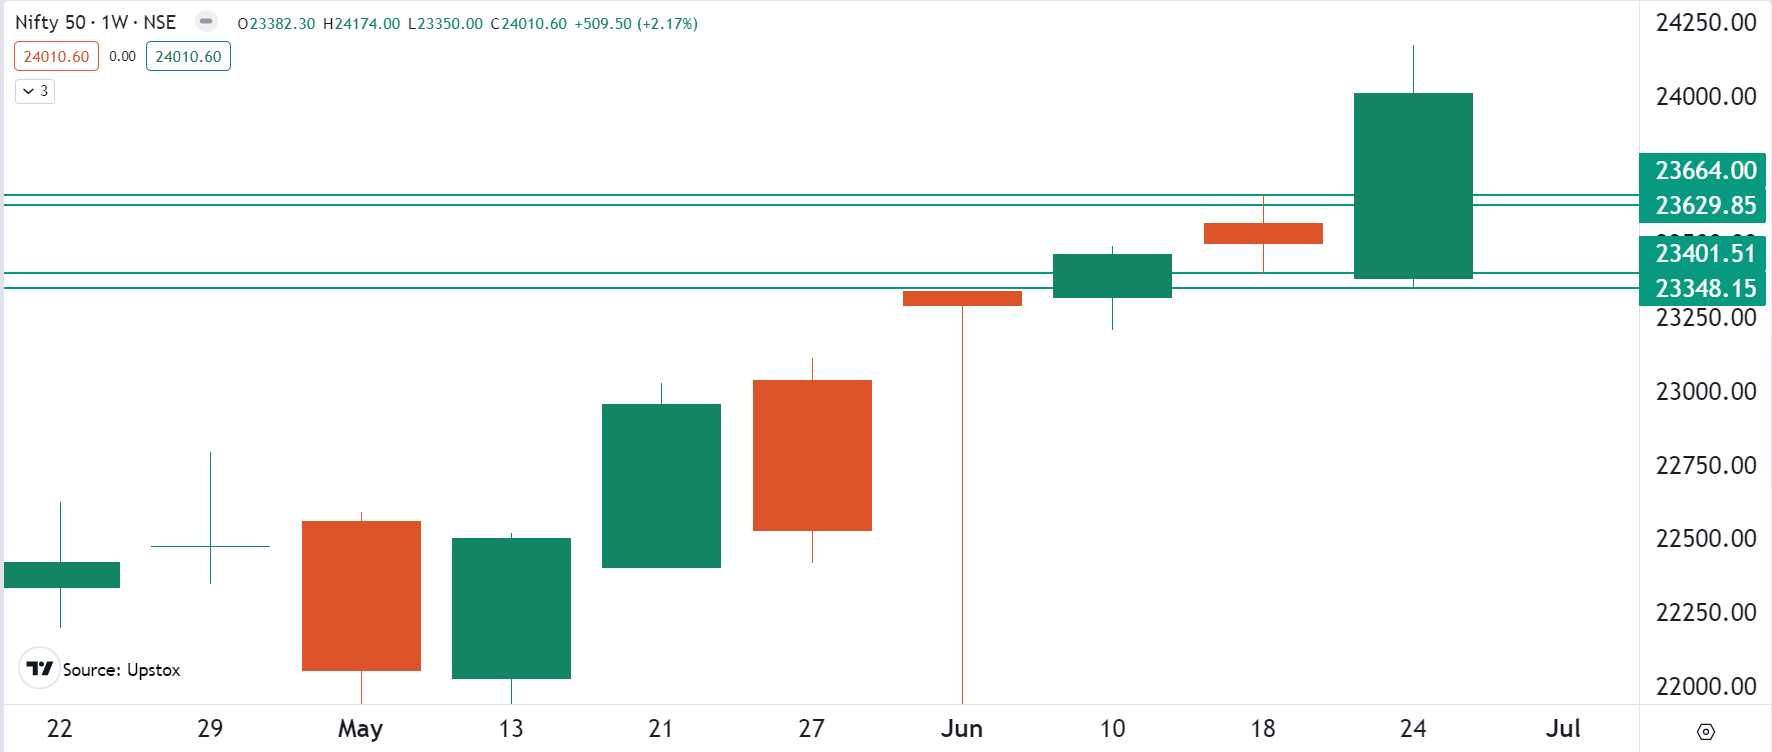
In last week's analysis, we advised our readers to watch the break of the high or low of the doji candle on the NIFTY50 for further directional clues. The index broke the high of the doji on 25th June and captured it on the closing basis. Thereafter, the index started its journey towards 24,000 and gave a directional move of nearly 2%.
The current technical structure of the NIFTY50 looks bullish as the index has formed a bullish engulfing candle on the weekly chart. This indicates the strength of buyers at lower levels. However, a small wick was formed on Friday due to profit-taking ahead of the weekend. For the coming sessions, the key support for the index is at 23,700 and 23,800. Until the index breaches this zone on a closing basis, the trend will remain positive.
F&O - BANK NIFTY outlook
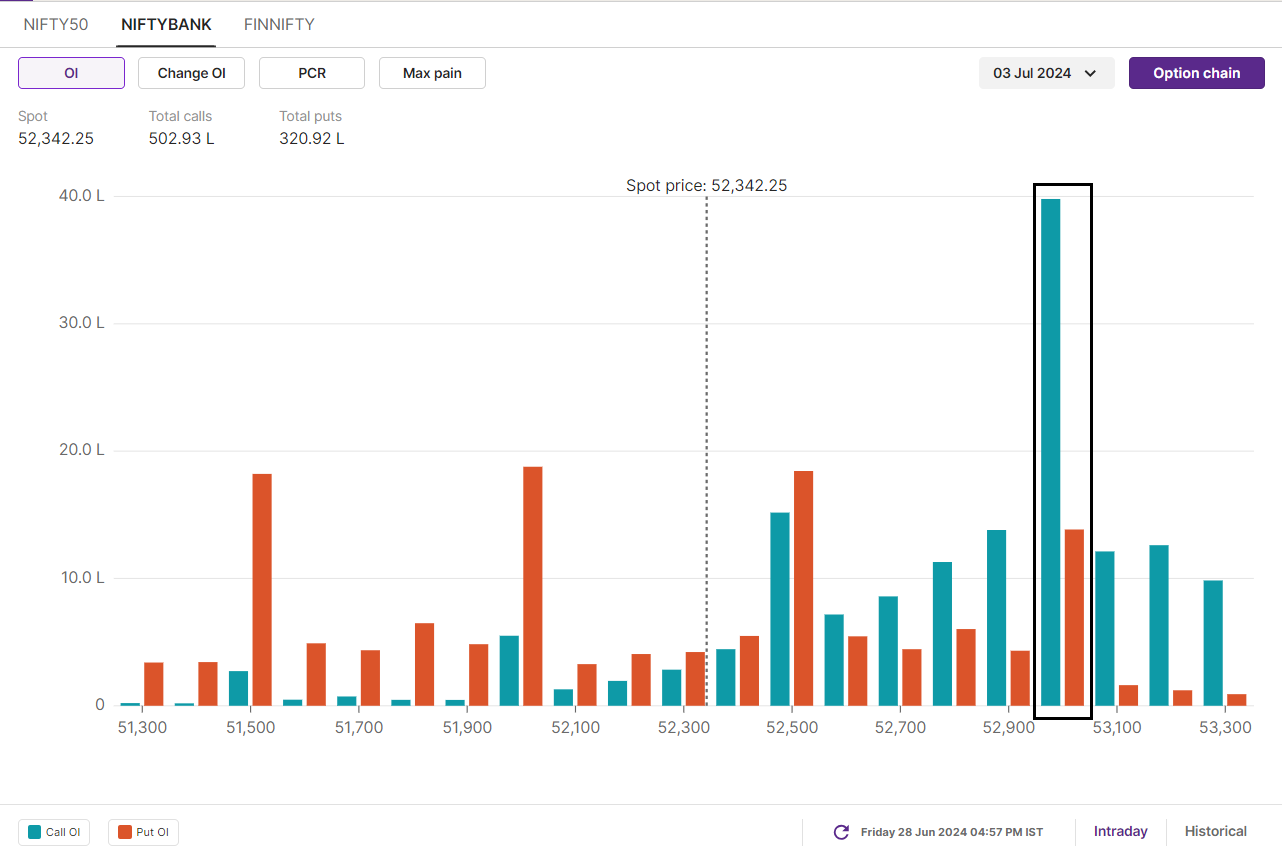
The open interest for the 3 July expiry has highest call option base at 53,000 strike, marking this as the immediate resistance for the index. On the flip side, the base of the put options is spread at 52,500, 52,000 and 51,500 strikes, highlighting this as support zones for the index. As per the options build-up, traders are expecting BANK NIFTY to trade between 51,000 and 53,500.
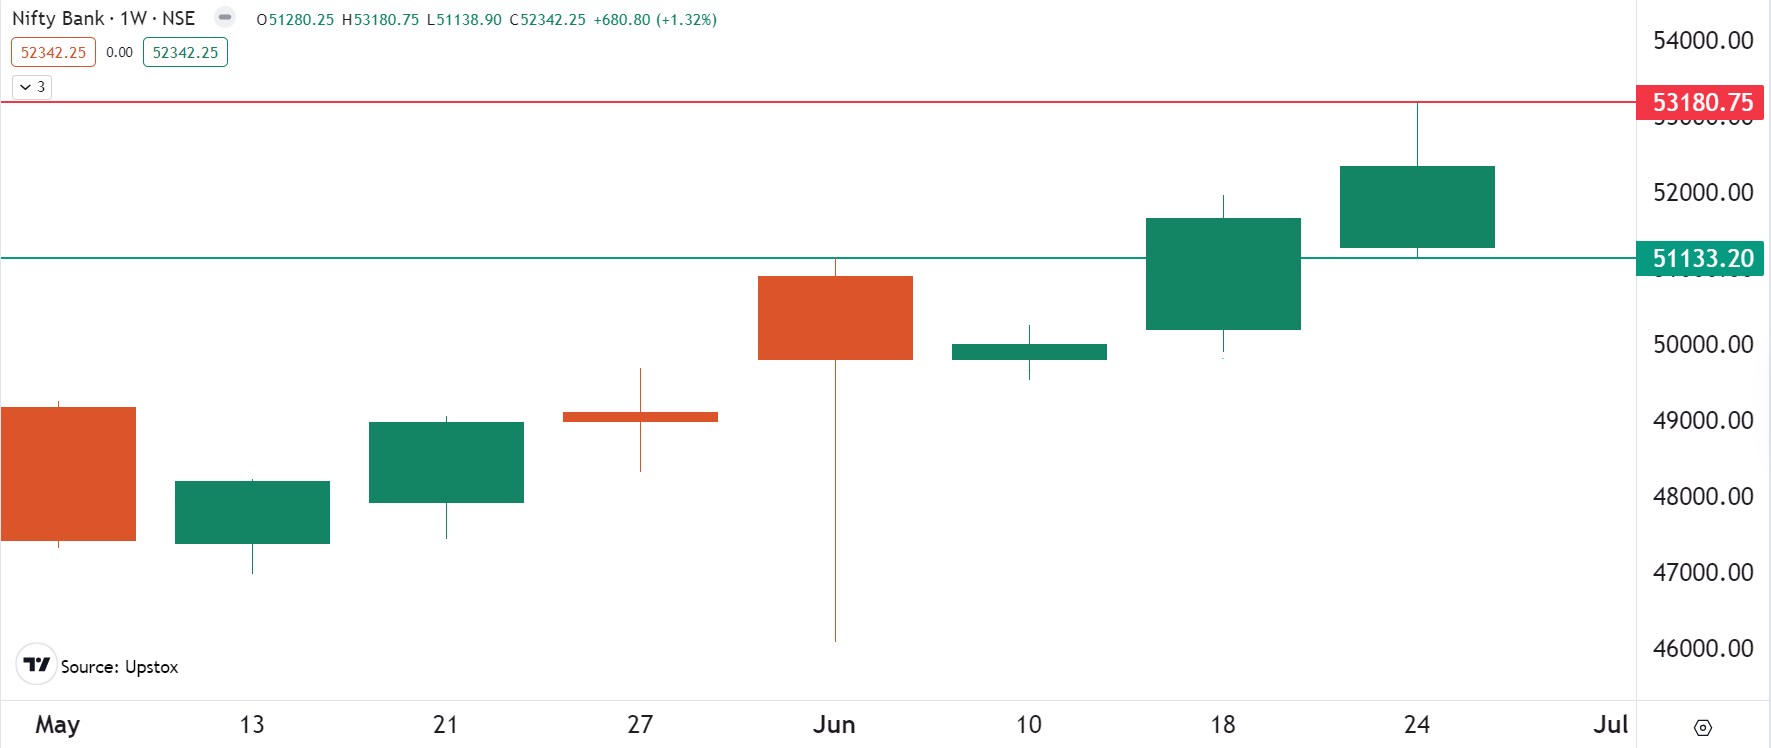
Our analysis of BANK NIFTY last week, showing no bearish signals turned positive. We highlighted to our readers that the index formed a bullish marubozu candle on the weekly chart, with immediate support at 51,000.
However, for the upcoming week, the charts indicate a potential pause in the momentum observed over the previous two weeks. Although BANK NIFTY closed above the previous week’s high, there was significant profit-booking in private banks on 28 June. The index formed a long upper shadow on weekly chart, reflecting the rejection it faced around the 53,000 zone. In the upcoming sessions, this zone will act as immediate resistance for the index. If it sips below 51,800, it may become range-bound with minor weakness.
Meanwhile, profit-booking in BANK NIFTY on 28 June has sent mixed signals. However, the index has still ended the week at record high and has shown signs of initial weakness on daily chart. A close below 51,000 mark on the daily chart, will turn the tide in favour of bears.
As we approach the build-up to the Union Budget, traders are advised to closely monitor the price action and open interest positioning. To stay ahead of all the intraday developments and trading levels, be sure to check out our daily morning trade setup blog, available before the market opens at 8am.
About The Author
Next Story


