Market News
Trade setup for Feb 7: NIFTY50 battles 23,800 resistance, 21 EMA support holds the key
.png)
4 min read | Updated on February 07, 2025, 07:22 IST


SUMMARY
The NIFTY50 index struggled to reclaim the 23,800 resistance zone, failing to sustain positive momentum for the second consecutive session. As the market awaits the RBI policy outcome, traders should closely watch the 23,800–23,400 range. A decisive close above or below this range could offer clearer directional cues.
Stock list
The SENSEX once again witnessed selling pressure at higher levels and failed to reclaim the crucial resistance zone of 78,600 zone. | Image: Shutterstock
Asian markets @ 7 am
- GIFT NIFTY: 23,704 (+0.04%)
- Nikkei 225: 38,953 (-0.29%)
- Hang Seng: 20,858 (-0.16%)
U.S. market update
- Dow Jones: 44,747 (▼0.2%)
- S&P 500: 6,083 (▲0.3%)
- Nasdaq Composite: 19,791 (▲0.5%)
U.S. indices ended mixed on Thursday as investors awaited Amazon's (AMZN) quarterly results and assessed the ongoing earnings season amid President Donald Trump’s policy changes.
While earlier tariff concerns eased, markets closely watched corporate earnings for any warning signs, particularly in the tech and semiconductor sectors. Meanwhile, shares of Ford Motor also slid 7% after forecasting a challenging 2025. On the other hand, Honeywell shares fell more than 5%, weighing on the Dow, after the company issued weaker-than-expected full-year earnings guidance.
NIFTY50
- February Futures: 23,688 (▼0.2%)
- Open interest: 2,23,832 (▲1.0%)
The NIFTY50 remained weak for another session on February 6, slipping 0.4% in a range-bound session as traders remained cautious ahead of the RBI MPC meeting outcome on February 7.
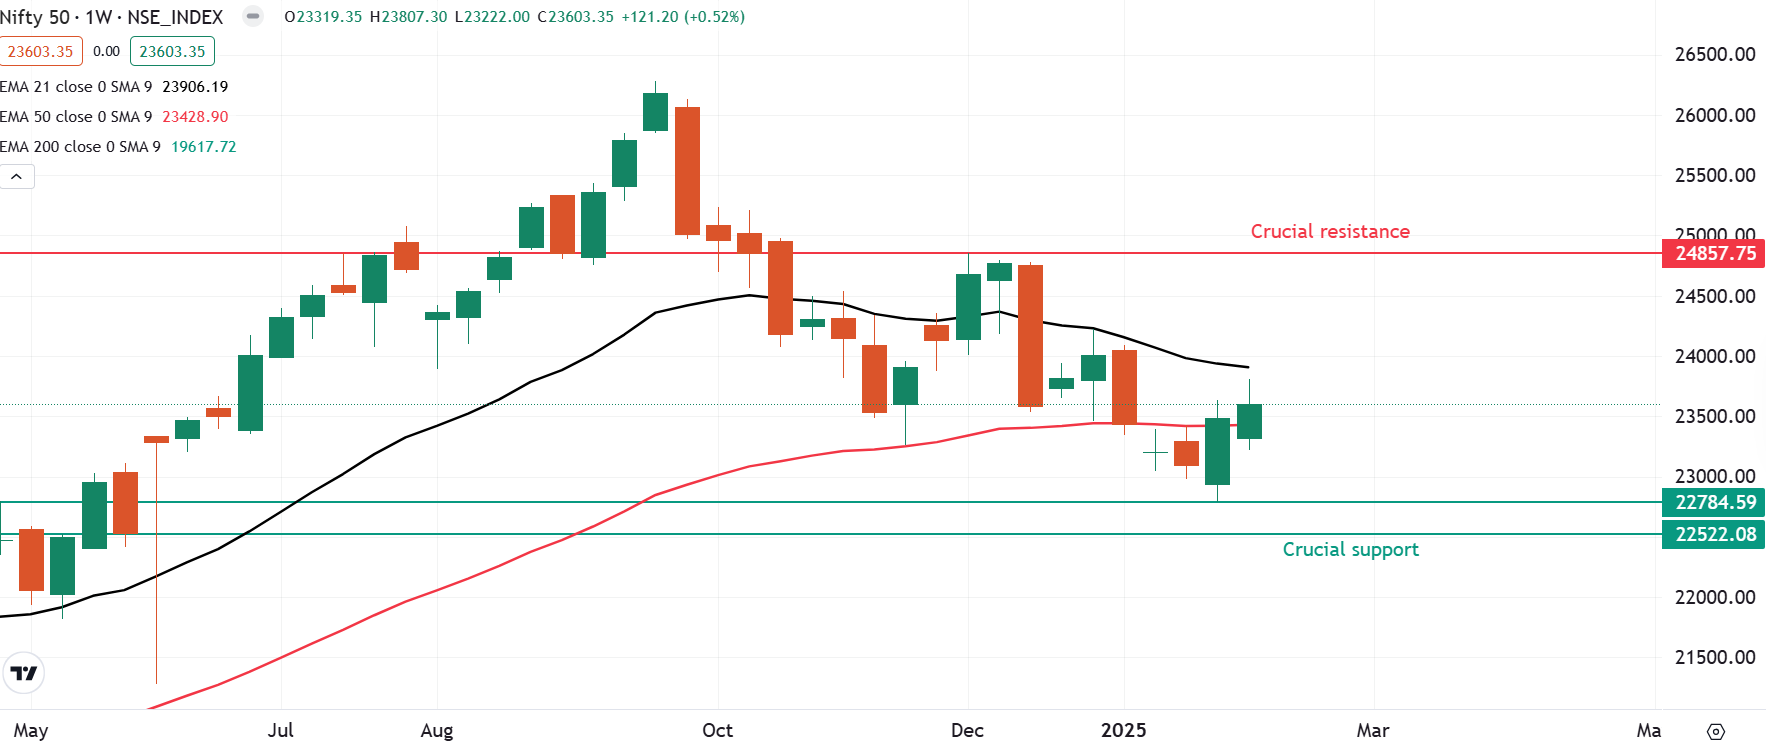
The NIFTY50’s weekly chart hints at a positive close. A close above the previous week's high would confirm continued momentum, while a drop below the key support at 23,400 could signal weakness.
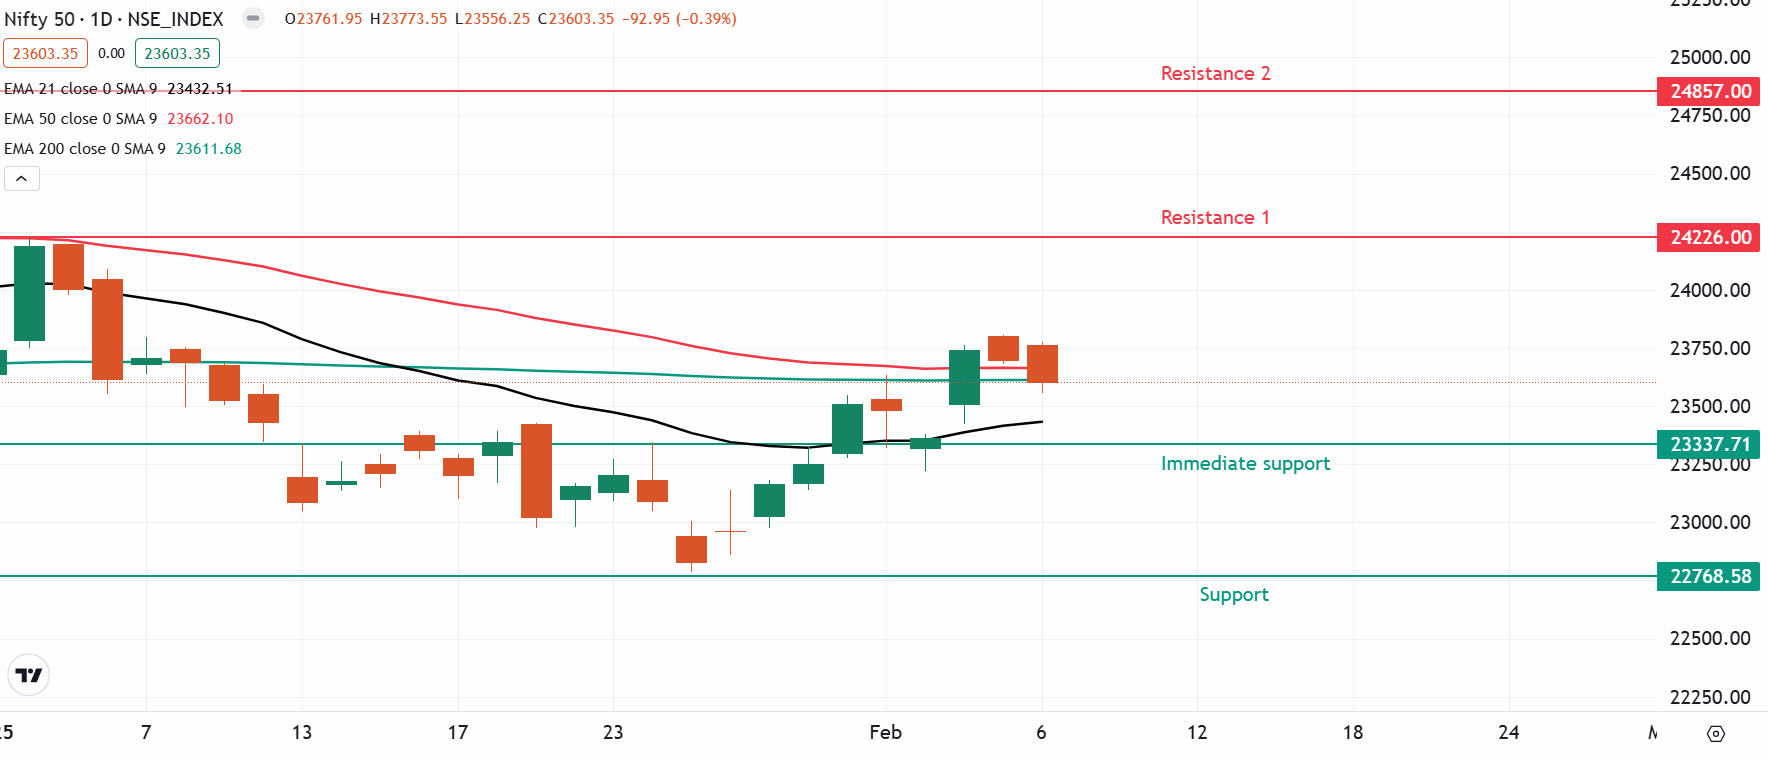
Meanwhile, according to the daily chart, the index is consolidating within the 23,400–23,800 range. A decisive breakout above or below this level on a closing basis could determine the next phase of momentum for the index.
SENSEX
- Max call OI: 78,500
- Max put OI: 78,000
- (30 Strikes from ATM, Expiry: 11 Feb)
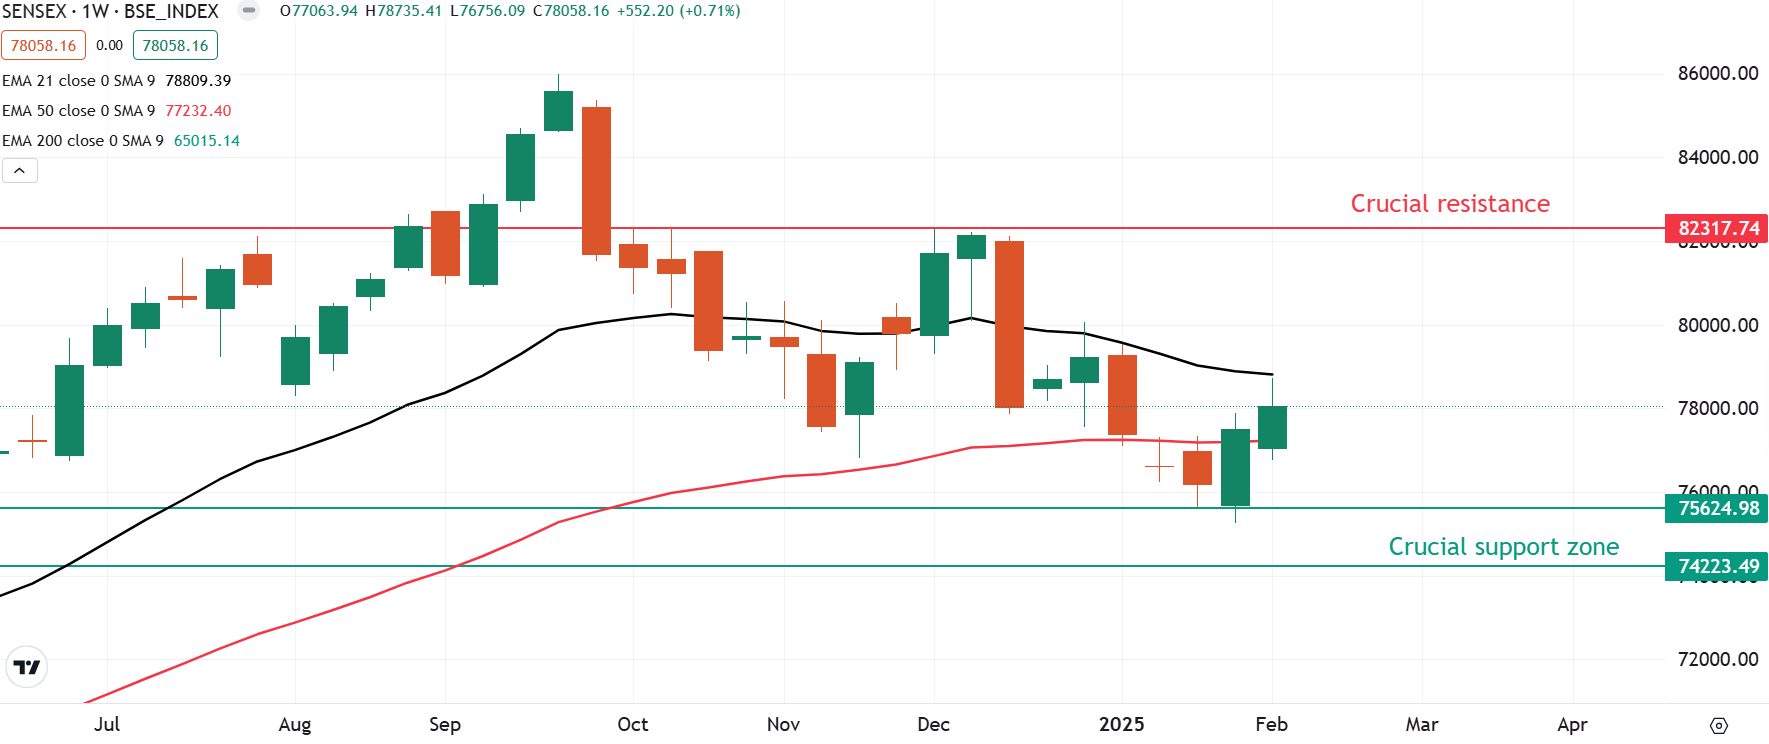
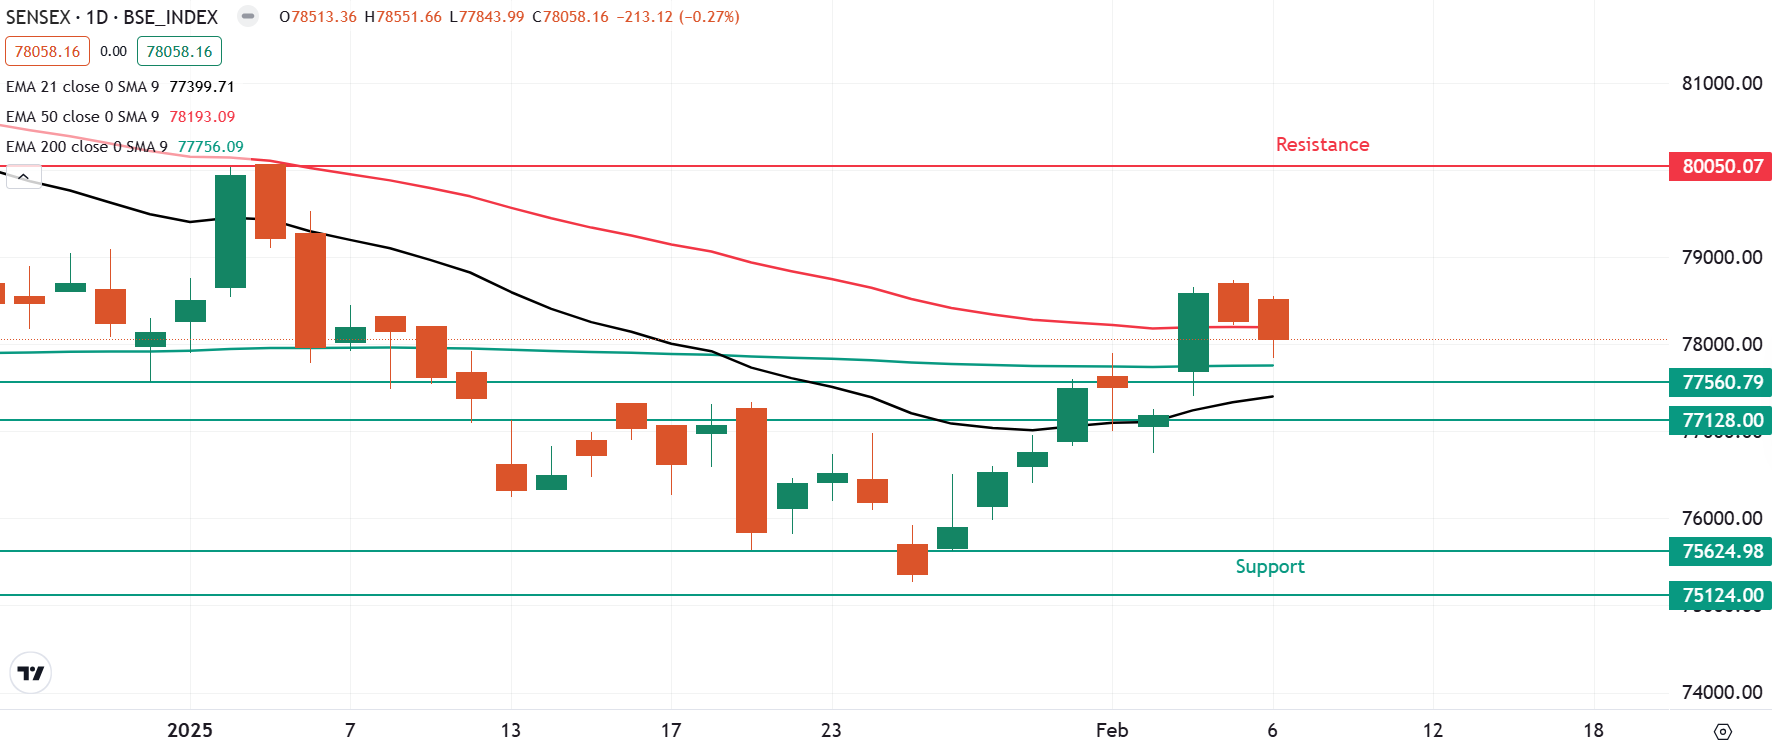
The SENSEX once again witnessed selling pressure at higher levels and failed to reclaim the crucial resistance zone of 78,600 zone. The index extended the weakness to the second day in a row and is currently trading a tad above its 200-day exponential moving average (EMA).
On the weekly chart, the SENSEX is hinting at a close above the previous week’s high, pointing towards the continuation of the positive momentum. However, if the fails to capture the previous week’s high and closes on a negative note, then it can extend the weakness up to 75,000 zone.
Meanwhile, the technical structure of the index as per the daily chart is currently consolidating within the range of 78,600 and 78,400. For further directional clues, traders can monitor this range as a break above or below this range on a closing basis will provide further insight.
FII-DII activity
Stock scanner
- Long build-up: Dr. Reddy’s Laboratories
- Short build-up: Trent, Solar Industries, Page Industries, Dixon Technologies and Polycab
- Top traded futures contracts: State Bank of India, Trent, HDFC Bank, Bajaj Finance and ICICI Bank
- Top traded options contracts: SBIN 760 CE, Trent 5700 CE, SBIN 770 CE, Trent 5800 CE and Trent 5700 PE
- Under F&O ban: Nil
In Futures and Options or F&O, long build-up means an increase in Open Interest (OI) along with an increase in price, and short build-up means an increase in Open Interest(OI) along with a decrease in price. Source: Upstox and NSE.
Disclaimer: Derivatives trading must be done only by traders who fully understand the risks associated with them and strictly apply risk mechanisms like stop-losses. The information is only for consumption by the client and such material should not be redistributed. We do not recommend any particular stock, securities and strategies for trading. The securities quoted are exemplary and are not recommendatory. The stock names mentioned in this article are purely for showing how to do analysis. Take your own decision before investing.
About The Author
Next Story


