Market News
TCS Q1 results preview: Revenue and profit likely to remain flat; key focus on dividend, margin and deal wins
.png)
4 min read | Updated on July 10, 2025, 09:31 IST


SUMMARY
TCS Q1 results will be announced on 10 July. The technical structure of the Tata Consultancy Services (TCS) remains sideways to bearish within the symmetrical chart pattern. Additionally, the stock is trading below all its key daily exponential moving averages, which indicates weakness.
Stock list

The technical structure of the TCS remains sideways to bearish as the stock trades below all its key exponential moving averages.
The IT giant Tata Consultancy Services (TCS) will open the first quarter earnings season on Thursday, 10 July. TCS is expected to announce its results after the market hours. Consequently, the stock will react to the earnings on Friday, 11 July.
TCS is expected to report a marginal increase in revenue of up to 1.5% on a sequential basis. Revenue is expected to remain between ₹64,320 and ₹64,620 crore, compared to ₹64,479 crore in the previous quarter and ₹62,613 crore in Q1 FY25. Revenue is likely to see low single-digit growth due to the winding down of key deals, such as the near-completion of the BSNL project. Meanwhile, foreign exchange gains could bolster the topline.
TCS's net profit is expected to remain stable at around ₹12,200 crore in the June quarter. The company reported net profit of ₹12,224 crore in Q4FY25 and ₹12,040 crore in Q1FY25. The EBIT margin is expected to decline by 20–40 basis points to 24.2%, and new deal wins are projected to be worth between $7 and $9 billion.
Investors will be looking to the TCS results for the management's commentary on U.S. tariffs and their impact on the company's overall business. The growth outlook in key verticals such as financial services, as well as the announcement of an interim dividend, will be key factors to watch out for. New deal wins, AI adoption will also be tracked closely.
Ahead of the Q1 results announcement, TCS shares are trading marginally lower at ₹3,380, down 0.1% per share on Thursday, July 10. So far this year, TCS stock has fallen by over 16% amid uncertainty surrounding US trade tariffs.
Technical View
The technical structure of the TCS remains sideways to bearish as the stock trades below all its key exponential moving averages like 21, 50 and 200. Additionally, it is also forming a symmetrical triangle pattern on the daily chart.
It is a chart pattern where price moves within converging trendlines, indicating indecision in the market. It typically precedes a breakout, which can occur in either direction, signalling a potential continuation or reversal of the trend.
.webp)
Options outlook
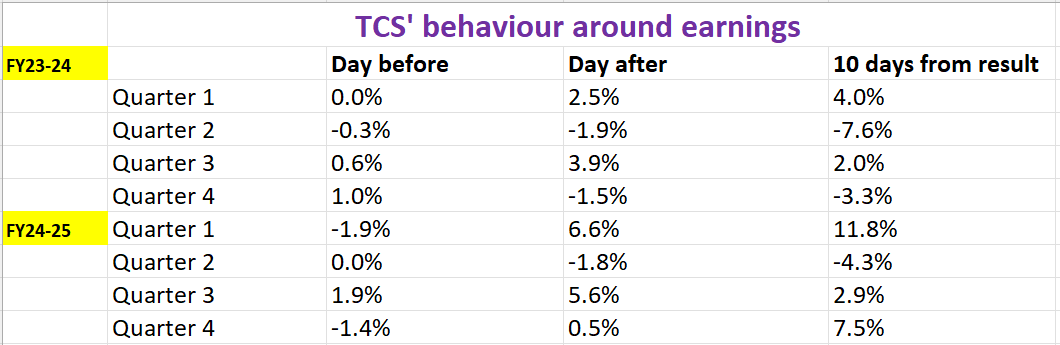
For the July 31st expiry, the open interest data shows significant call writing at the 3,500 strike, pointing to likely resistance in that range. Additionally, the at-the-money strike of 3,400 is priced at ₹155, implying an expected move of around ±4.6%. To gauge whether that's realistic, it's worth looking at how TCS has moved around earnings announcements in the past.
Options strategy for TCS
With the options market pricing in a ±4.6% move for the TCS until July 31st , traders have the opportunity to take advantage of the expected volatility. Depending on your view, you can position yourself with a long straddle or short straddle strategy.
Long Straddle:
This strategy involves buying an at-the-money (ATM) call and put option with the same strike and expiry. This strategy benefits if the stock moves more than ±4.6% in either direction.
Short straddle:
The strategy involves selling both a call and a put with the same strike and expiry. This approach profits if the stock stays within the ±4.6% range, as time decay and lower volatility works in your favour.
Disclaimer:
Derivatives trading must be done only by traders who fully understand the risks associated with them and strictly apply risk mechanisms like stop-losses. The information is only for educational purposes. We do not recommend any particular stock, securities and strategies for trading. The stock names mentioned in this article are purely for showing how to do analysis. Take your own decision before investing.
About The Author
Next Story