Market News
SBI Q1 results preview: Net profit likely to see muted growth as interest income and NIM may fall amid repo rate cuts
.png)
4 min read | Updated on August 08, 2025, 11:06 IST


SUMMARY
State Bank of India is set to report muted Q1 earnings on August 8, with net profit seen flat due to high funding costs and repo rate pass-through. Net interest income is expected to grow modestly by 2–3% YoY. NIM may contract by 25–30 bps to 2.85%. Technically, the stock remains rangebound between ₹785–₹835, awaiting a breakout.
Stock list
SBI technical structure remains in a range and is trading above its 200-day exponential moving average (EMA). | Image: Shutterstock
India’s largest public sector bank, State Bank of India (SBI), will announce its first-quarter results on August 8, 2025. The bank is expected to report subdued quarterly earnings, impacted by high funding costs and the pass-through of previous repo rate cuts by the Reserve Bank of India (RBI).
According to experts, SBI’s standalone net profit could rise by 0-1% YoY between ₹16,990 and ₹17,170 crore, compared to a net profit of ₹17,035 crore in Q1FY25. Meanwhile, the Net interest income (NII) is expected to increase by 2-3% YoY to ₹42,250 to ₹42,410 crore. Despite subdued earnings, SBI could report healthy double-digit growth in loan books and deposits.
Meanwhile, net interest margin (NIM) is likely to decline by 25 to 30 basis points to 2.85% because of an increase in the cost of funds and the recent repo rate cut by the RBI.
During the quarterly result announcement, investors will track management commentary on credit growth within the industry and impact of recent repo rate cuts. Key performance metrics, including loan and deposit growth, net interest margin, gross and net non-performing assets (NPAs) will also be watched closely.
Ahead of the Q1 result announcement, SBI shares are trading 0.6% lower at ₹800 per share on August 8. So far this year, SBI shares are marginally higher by 1.2%.
Technical view
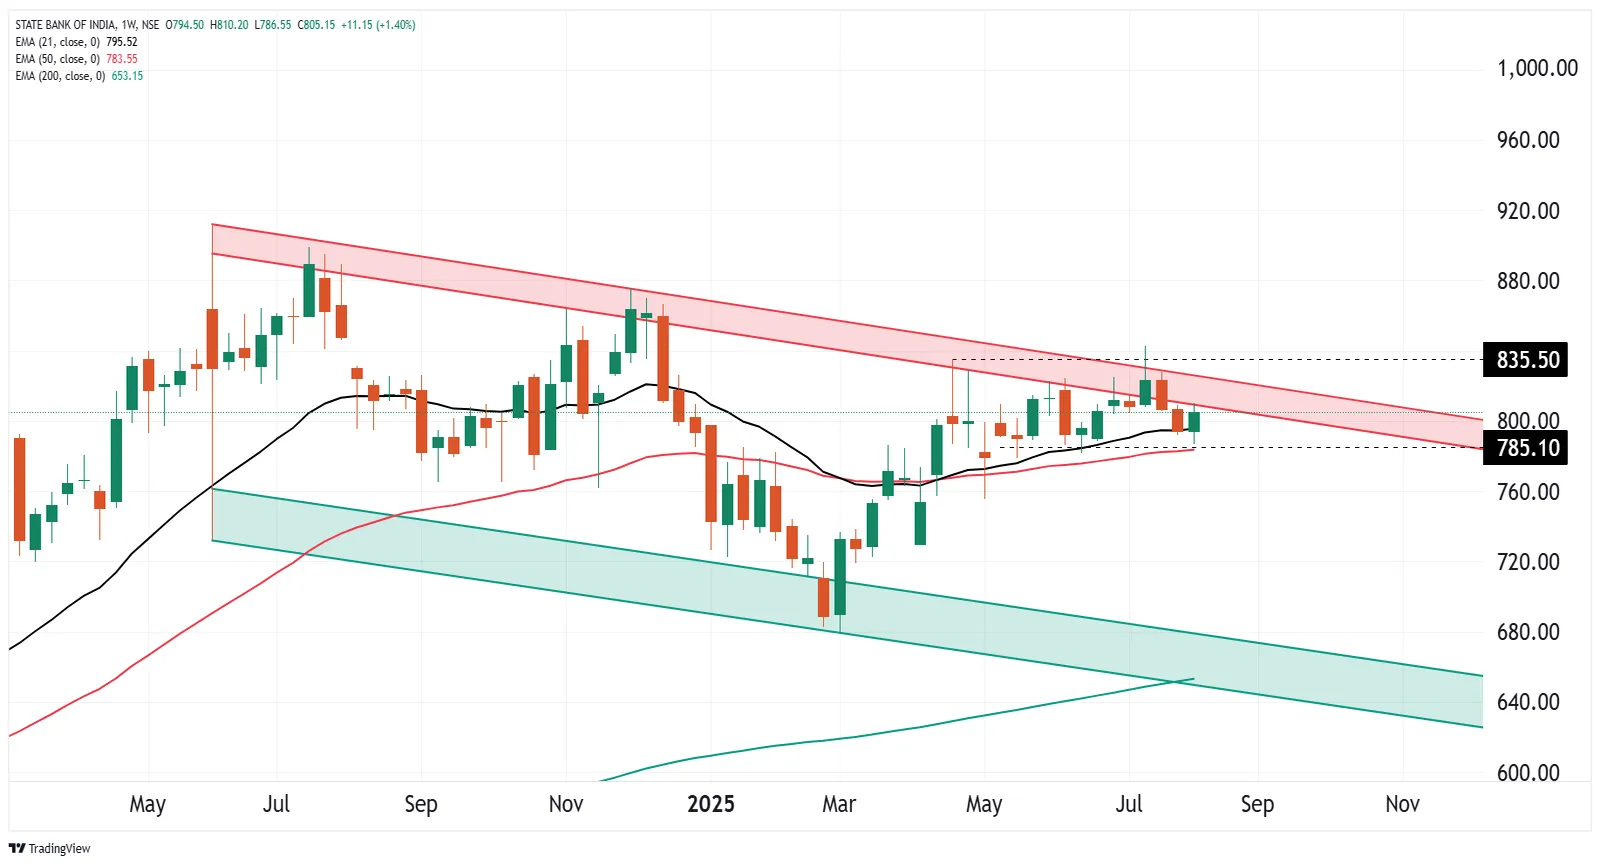
The technical structure of SBI remains in a range and is trading above its 200-day exponential moving average (EMA). It has formed a bullish candle near the crucial support zone of 200-EMA and is trading near the crucial resistance zone of downward sloping trendline connecting its previous all-time high.
Meanwhile, for short-term clues, traders can monitor the crucial support zone of ₹785 and the resistance zone of ₹835. Within this range, the stock may remain sideways. However, a break of this range on a closing basis will provide directional insights.
Options outlook
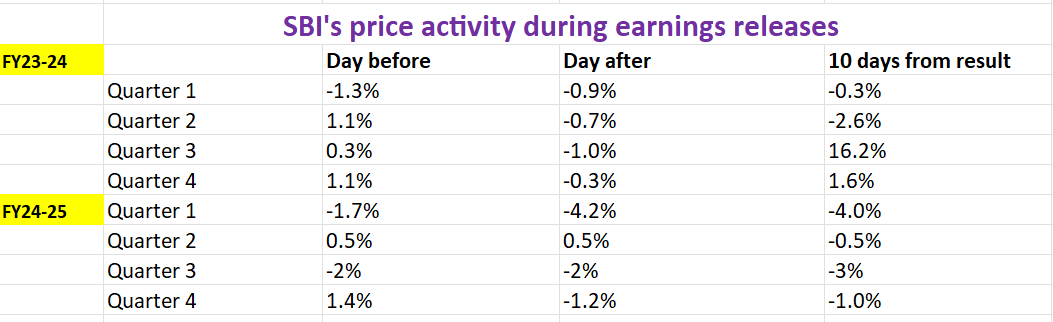
For further understanding, let’s take a look at the historical price behaviour of SBI around its earnings announcement.
Options strategy for State Bank of India
The options data for SBI's May 28th August expiry shows a potential price movement of ±3.5%, providing strategic opportunities for traders based on their volatility expectations.
Strategies based on volatility expectations:
- Expectation of increased volatility: Traders who expect that the volatility in SBI may rise can consider a Long Straddle strategy. This strategy involves buying both an ATM call and an ATM put option with the same strike price and expiry date. This approach will benefit if the price of SBI moves significantly beyond the range of ±3.5% in either direction.
- Expectation of lower volatility: Traders who expect volatility will remain low, a Short Straddle may be more suitable. This strategy involves selling both an ATM call and an ATM put option with the same strike price and expiry, and profiting if the price of SBI stays within ±3.5%.
Traders anticipating a break below 200-day EMA on a closing basis or a break above the immediate resistance of ₹835 can consider directional spreads.
- For a bullish outlook, traders can consider a bull call spread. This strategy involves buying a call option and simultaneously selling another call option with a higher strike price of the same expiry. This approach lowers the initial cost but also limits potential profits.
- On the other hand, traders expecting a drop in price can initiate a bear put spread. It involves buying a put option while selling a lower strike put, creating a strategy that balances risk and reward.
Disclaimer:
Derivatives trading must be done only by traders who fully understand the risks associated with them and strictly apply risk mechanisms like stop-losses. The information is only for educational purposes. We do not recommend any particular stock, securities and strategies for trading. The stock names mentioned in this article are purely for showing how to do analysis. Take your own decision before investing.
About The Author
Next Story


