Upstox Originals
Bottoming out in progress: Why the IT sector deserves a closer look

5 min read | Updated on May 30, 2025, 13:16 IST


SUMMARY
As investors look for opportunities in a volatile albeit range bound market, technical indicators for the Nifty IT index look optimistic. A word of caution however, the current set up is promising, and many stocks exhibit interesting setups. However, these are all still in early stages and investors should enter in staggered manner while looking out for confirmation signs.

Nifty IT index's current technical set up is cautiously optimistic
Throughout the current month (May), the broader markets have largely remained in a consolidation phase, trading within a well-defined range. The Nifty50 continues to stay above all its key moving averages—a technically positive sign—yet it lacks a decisive directional bias. This lack of clear momentum has led to the formation of a narrow trading corridor, with resistance positioned near the 25,150 level and support established at 24,500.
Until either of these levels is breached, the index is likely to remain directionless, oscillating within this range. A move above 25,150 would be required to signal the potential start of a fresh uptrend, while a breakdown below 24,500 could trigger further weakness and possibly a short-term corrective phase.
Nifty IT: Signs of a bottoming process amid sector rotation
A closer examination of sector rotation using the Relative Rotation Graphs (RRG), with the Nifty 500 Index as the benchmark, reveals emerging shifts in sector leadership. The RRG tool helps visualise the relative strength and momentum of various sector indices, and current readings suggest that some leadership churn is underway.
Sectors that have been in the leading quadrant are now beginning to lose relative momentum, while those in the lagging quadrant are showing early signs of revival.
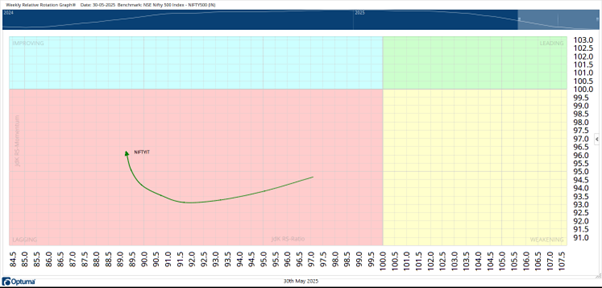
The Nifty IT Index is a classic case in point. Although it currently resides in the lagging quadrant—typically associated with underperformance—a deeper look reveals a different story. The tail of the IT index on the RRG is moving in a northeasterly direction, which indicates a steady improvement in relative momentum.
This directional change suggests that the phase of relative underperformance may be concluding, and the sector could be in the early stages of a bottoming-out process. For retail investors, this is a crucial development, as it implies potential opportunities may emerge in this space, particularly if the trend of improving relative strength continues in the coming weeks.
Technical structure suggests bottoming in Nifty IT
While the Nifty IT Index continues to appear in the lagging quadrant of the Relative Rotation Graph (RRG), its improving relative momentum is reflected in its price structure as well. A detailed look at the daily chart shows that the index is in the process of bottoming out after a sustained corrective phase. The IT index remained under pressure from December of the previous year through April, forming a well-defined downward trajectory.
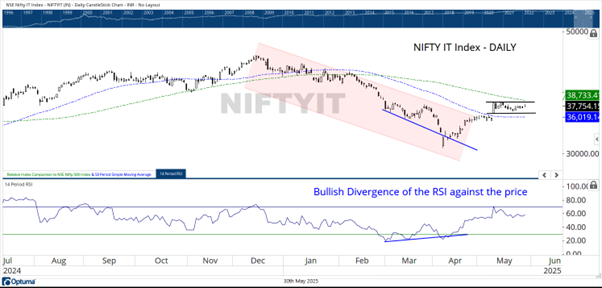
This decline, however, culminated in a potential reversal setup. In early April, the index found support and began trending higher. Notably, this final leg of the decline was marked by a bullish divergence between price and the Relative Strength Index (RSI)—while price made lower lows, the RSI did not, indicating a loss of downside momentum and hinting at an impending reversal.
At present, the index is moving sideways. A decisive move above the 38,800 level would lend confirmation to this reversal attempt and strengthen the case for a sustained recovery.
Key IT stocks exhibit early signs of strength
A closer review of individual components within the Nifty IT Index highlights several stocks showing early signs of trend reversal and technical improvement, reinforcing the sector's bottoming narrative.
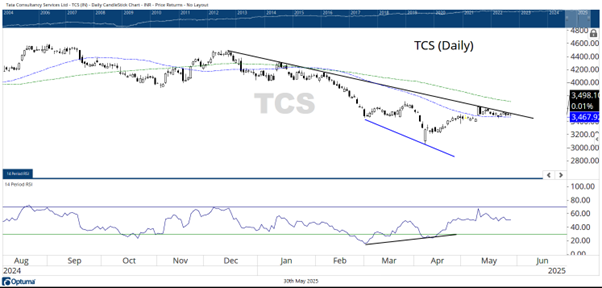
TCS is showing a clear reversal attempt. After bottoming out in April, aided by a bullish divergence between the RSI and price action, the stock is now consolidating above its 50-day moving average (DMA), indicating underlying strength and a potential resumption of its upward move.
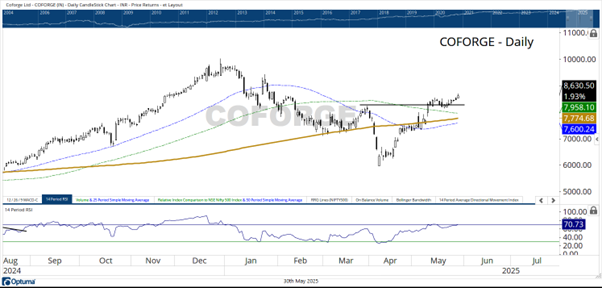
COFORGE has already confirmed a trend reversal. The stock rebounded sharply from its April lows and broke above a significant double-top resistance near ₹8,200. This level now acts as a strong support zone, and the stock trades comfortably above all key moving averages.
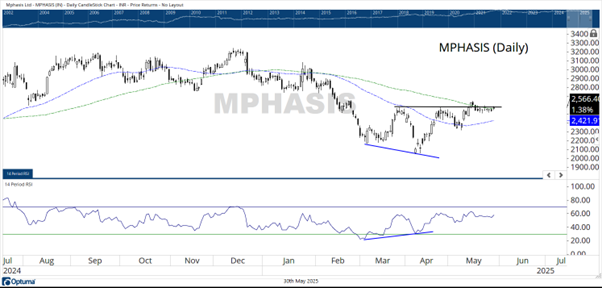
MPHASIS mirrors similar technical behavior, with a bullish RSI divergence marking its recent bottom. The stock is currently testing its 100-DMA and appears poised to break above its immediate horizontal resistance.
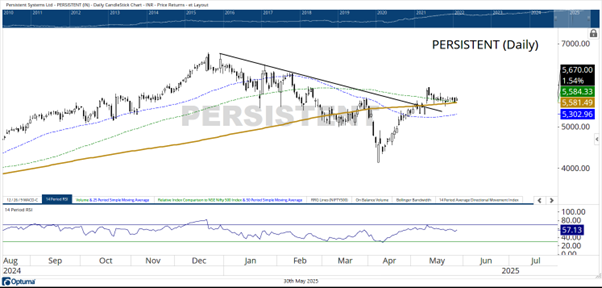
PERSISTENT has breached its falling trendline resistance. It remains in a healthy consolidation phase, finding support at the confluence of its 50- and 200-DMAs, suggesting strength in the base-building process.
Cautious optimism: IT sector deserves a closer look
While the Nifty IT Index continues to remain in the midst of a bottoming-out process, it is not yet positioned for aggressive accumulation. However, the importance of recognizing such transitional phases cannot be overstated. Identifying the early signs of a potential turnaround allows investors to position themselves strategically ahead of broader market participation.
The current technical and relative strength setup in the IT space certainly warrants increased attention and deserves a gradual increase in the portfolio's exposure. Investors may consider gradually increasing their exposure in a staggered manner. Importantly, the sector's distance from the center of the RRG chart also suggests that once a full reversal takes shape, the IT sector holds significant potential to deliver alpha outperformance relative to its peers.
About The Author
Next Story

