Upstox Originals
NBFCs leading the next phase of credit growth?
.png)
11 min read | Updated on July 28, 2025, 17:03 IST


SUMMARY
As traditional banks focus on secured and formal segments, NBFCs have taken the lead in offering customised financial solutions to underserved markets, ranging from MSMEs and informal sector participants to first-time retail borrowers in Tier 2 and Tier 3 cities. This article presents a structured analysis of the NBFC sector’s performance in FY2025, supported by peer comparison.
Stock list

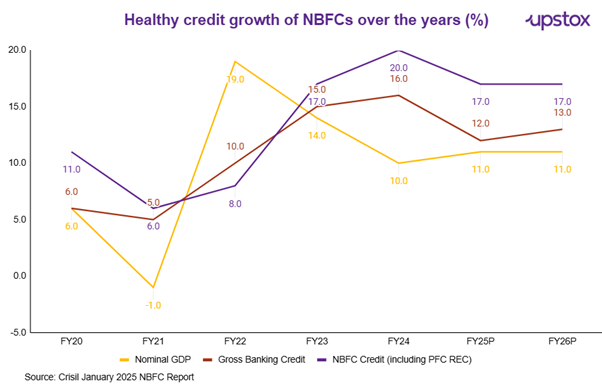
From FY22 to FY25 NBFC credit growth has exceeded both nominal GDP and gross banking credit
From FY22 to FY25, NBFC credit growth continuously exceeded both nominal GDP and gross banking credit, demonstrating their growing significance in India's lending environment. NBFCs are expected to continue to outperform systemic banking credit through FY26, even as growth slows after FY24.
NBFC evolution
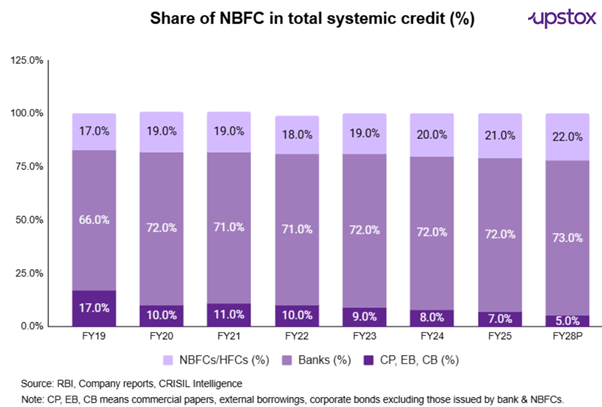
NBFCs have developed innovative lending solutions for the informal, semi-formal, and underbanked markets, targeting MSMEs, independent contractors, and clients in Tier 2 and Tier 3 cities. NBFCs' share in overall systemic credit grew from 12% in FY08 to 21% in FY25.
What makes NBFC intriguing now? The rate cut impact
According to the RBI Financial Stability Report, the cost of funds for NBFCs (AAA rated) has decreased by 0.65% between December 24 and June 25. According to Crisil, this can increase NBFC profitability beginning in H2FY25.
NBFCs experienced a moderate year in FY25, characterised by cautious credit growth and regulatory tightening. However, the sector is picking up steam as rate cuts begin, inflation starts to decline, and there are early indications of a recovery in consumer spending. Hence, we thought its right time to do peer comparison of NBFCs.
Key metrics of NBFCs
| Metric | Particulars | Which is better? |
|---|---|---|
| AUM (₹ Cr) | AUM is essentially the total outstanding value of all the loans it has disbursed. | Higher |
| PAT (₹ Cr) | It is the absolute bottom-line profit. A higher PAT signifies strong profitability and earnings power. | Higher |
| RoA (%) | This ratio measures how efficiently an NBFC uses its assets (its loan book) to generate profit. | Higher |
| RoE (%) | This ratio measures the return the company generates on the money invested by its shareholders (equity). | Higher |
| Net Interest Margin (NIM) | NIM is the difference between the interest income earned on loans and the interest paid on borrowings. | Higher |
| Cost of Funds (%) | This is the average interest rate an NBFC pays to borrow money from banks, financial institutions, or through market instruments like bonds and commercial papers. | Lower |
| Capital Adequacy Ratio (CAR) | It compares its capital against its risk-weighted assets (like loans). | Higher |
| Debt/Equity Ratio | This ratio shows how much debt the company is using relative to its capital (shareholders' funds). | Lower |
| Credit Rating | An independent assessment by agencies like CRISIL, ICRA, etc., on the NBFC's ability to repay its debt. | Higher |
Peer comparison
Assets under management
Bajaj Finance led the NBFC peer set with the largest AUM of ₹3.1 trillion. But with a CAGR of 31.8%, Aditya Birla Finance reported the fastest growth. Even the biggest NBFCs have a low single-digit market share, which emphasises the industry's extreme fragmentation and the substantial room for consolidation.
AUM comparison of NBFC peers
| Peers | Aditya Birla Finance | Bajaj Finance | Cholamandalam Investment & Finance | HDB Financial Services | L&T Finance | Mahindra & Mahindra Finance | Shriram Finance | Sundaram Finance |
|---|---|---|---|---|---|---|---|---|
| AUM in FY25 (₹ bn) | 1,263.5 | 3,088.3 | 1,847.5 | 1,072.6 | 977.6 | 1,196.7 | 2,631.9 | 514.8 |
| CAGR FY22–FY25 | 31.8% | 28.2% | 30.6% | 20.4% | 3.4% | 14.5% | 27.5% | 20.4% |
Source: Company Reports & Crisil Intelligence
Loan Book Quality: Secured vs. Unsecured Mix
Understanding their cautious risk frameworks and emphasis on collateral-backed lending, Sundaram Finance (99.8%), Mahindra Finance (94.9%), and Shriram Finance (90.5%) maintained primarily secured loan books in FY25.
Share of secured vs unsecured loans – FY25
| Peers | Secured (%) | Unsecured (%) |
|---|---|---|
| Aditya Birla Finance | NA | NA |
| Bajaj Finance | 47.7% | 52.3% |
| Cholamandalam Investment and Finance | 91.2% | 8.8% |
| HDB Financial Services | 73.0% | 27.0% |
| L&T Finance | 55.4% | 44.6% |
| Mahindra & Mahindra Finance | 94.9% | 5.2% |
| Shriram Finance | 90.5% | 9.5% |
| Sundaram Finance | 99.8% | 0.2% |
| Tata Capital | NA | NA |
Source: Company reports
Earnings
With a PAT of ₹166.6 billion in FY25, Bajaj Finance led the peer group. The majority of peers' high double-digit profit growth indicates the scalability and resilience of broad-based earnings.
With the highest ROE (20.83%) in FY25, despite high operating expenses as a percentage of the loan book, Bajaj Finance outperformed its peers in terms of profitability. This was supported by robust yields (18.8%) and the best NII (12.1%) in the industry. With ROEs above 18% and managed credit costs, Shriram Finance and Cholamandalam also demonstrate exceptional operational efficiency.
Key profitability ratios in FY25
| Peers | Aditya Birla Finance | Bajaj Finance | Cholamandalam Investment and Finance | HDB Financial Services Limited | L&T Finance | Mahindra & Mahindra Finance | Shriram Finance | Sundaram Finance | Tata Capital |
|---|---|---|---|---|---|---|---|---|---|
| Yield on advances (%) | 12.4% | 18.8% | 14.3% | 14.0% | 16.0% | 13.8% | 16.7% | 12.4% | 14.7% |
| Cost of borrowings (%) | 7.9% | 7.4% | 8.1% | 7.9% | 7.1% | 7.6% | 8.8% | 7.4% | 8.8% |
| NII (%) | 5.4% | 12.1% | 6.8% | 7.6% | 9.5% | 6.7% | 9.1% | 5.3% | 6.4% |
| Opex (%) | 1.9% | 5.1% | 3.2% | 4.9% | 4.4% | 3.1% | 3.0% | 2.3% | 3.5% |
| PPoP (%) | 4.8% | 9.9% | 5.0% | 5.1% | 6.5% | 4.3% | 6.8% | 5.0% | 4.9% |
| Credit cost (%) | 1.3% | 2.9% | 1.5% | 2.1% | 2.4% | 1.5% | 2.2% | 0.5% | 2.3% |
| ROA (%) | 2.4% | 5.0% | 2.4% | 2.2% | 2.4% | 1.9% | 3.7% | 2.8% | 1.7% |
| ROE (%) | 14.6% | 20.8% | 19.7% | 14.7% | 10.8% | 12.4% | 18.6% | 15.0% | 10.9% |
Source: Company Reports & Crisil Intelligence
Leverage, Coverage & Asset Quality Benchmarking – FY25
With robust capital adequacy ratios of 21.9% and 22.3%, respectively, and healthy Tier-1 capital above 20%, Bajaj Finance and L&T Finance led the peer group in FY25. Additionally, L&T Finance reported the highest provision coverage ratio (71%), demonstrating a robust defence against asset stress.
Capital structure and provisioning strength in FY25
| Peers | Aditya Birla Finance | Bajaj Finance | Cholamandalam Investment and Finance | HDB Financial Services | L&T Finance | Mahindra & Mahindra Finance | Shriram Finance | Sundaram Finance | Tata Capital |
|---|---|---|---|---|---|---|---|---|---|
| Capital Adequacy Ratio (%) | 18.2% | 21.9% | 19.8% | 19.2% | 22.3% | 18.3% | 20.7% | 20.4% | 16.9% |
| Debt/Equity | 4.5 | 3.2 | 7.7 | 5.9 | 3.9 | 5.9 | 4.5 | 4.2 | 5.5 |
| Tier-1 Capital (%) | 15.9% | 21.1% | 14.4% | 14.7% | 20.8% | 15.2% | 20.0% | 0.0% | NA |
| Provision Coverage Ratio (%) | 45.0% | 53.0% | 45.3% | 56.0% | 71.0% | 51.2% | 43.3% | 49.0% | NA |
Source: Company Reports & Crisil Intelligence
With the lowest GNPA (1.18%) and NNPA (0.56%), Bajaj Finance stood out in terms of asset quality, demonstrating strong underwriting and high-quality portfolios.
Asset quality trends across FY24 and FY25
| Peers | Aditya Birla Finance | Bajaj Finance | Cholamandalam Investment and Finance | HDB Financial Services | L&T Finance | Mahindra & Mahindra Finance | Shriram Finance | Sundaram Finance | Tata Capital |
|---|---|---|---|---|---|---|---|---|---|
| Gross NPA Ratio FY24 | 2.5% | 1.1% | 2.5% | 1.9% | 3.2% | 3.4% | 5.5% | 1.7% | 1.5% |
| Gross NPA Ratio FY25 | 2.2% | 1.2% | 2.8% | 2.3% | 3.3% | 3.7% | 4.6% | 1.4% | 2.3% |
| Net NPA Ratio FY24 | 1.3% | 0.5% | 1.3% | 0.6% | 0.8% | 1.3% | 2.7% | 0.6% | 0.4% |
| Net NPA Ratio FY25 | 1.2% | 0.6% | 1.5% | 1.0% | 1.0% | 1.8% | 2.6% | 0.8% | 1.0% |
Source: Company Reports & Crisil Intelligence
ALM Position – FY25: Broadly Comfortable
Overall, NBFCs show a strong ALM position in FY25. While players like Bajaj Finance and Shriram Finance show short-term mismatches, their sizable near-term asset surpluses help offset the gap.
| Peers | Asset (₹ billions) | Asset (₹ billions) | Liabilities (₹ billions) | Liabilities (₹ billions) | Net (₹ billions) | Net (₹ billions) | Asset-Liability Ratio* | Asset-Liability Ratio* |
|---|---|---|---|---|---|---|---|---|
| Within 12 Months | After 12 Months | Within 12 Months | After 12 Months | Within 12 Months | After 12 Months | Within 12 Months | After 12 Months | |
| Bajaj Finance | 1946.0 | 1956.9 | 1242.4 | 2605.1 | 703.7 | -648.1 | 1.6 | 0.8 |
| Cholamandalam Investment and Finance | 722.2 | 1317.8 | 615.5 | 1424.5 | 106.7 | -106.7 | 1.2 | 0.9 |
| HDB Financial Services | 398.1 | 688.6 | 412.4 | 516.0 | -14.3 | 172.5 | 1.0 | 1.3 |
| L&T Finance | 525.0 | 675.3 | 550.0 | 397.4 | -25.0 | 277.9 | 1.0 | 1.7 |
| Mahindra & Mahindra Finance | 546.0 | 809.5 | 417.1 | 740.2 | 128.8 | 69.3 | 1.3 | 1.1 |
| Shriram Finance | 1326.2 | 1610.4 | 665.1 | 2301.4 | 661.1 | -691.0 | 2.0 | 0.7 |
Source: Company Reports & Crisil Intelligence
Valuation
From a pure valuation perspective based on the Price to Book (P/B) ratio, Mahindra & Mahindra Financial Services Ltd appears to be the cheapest among the companies.Whereas, Bajaj Finance Ltd appears to be the most expensive or overvalued company based on several key metrics.
| Company Name | Market Cap (₹ Cr) | Price to Book (P/B) |
|---|---|---|
| Aditya Birla Finance | NA | NA |
| Bajaj Finance | 5,93,681.82 | 6.14 |
| Cholamandalam Inv.& Fin | 1,31,863.00 | 5.56 |
| HDB Financial Services | 66,390.21 | NA |
| L&T Finance | 52,302.00 | 2.06 |
| Mahindra & Mahindra Finance | 36,292.00 | 1.7 |
| Shriram Finance | 1,20,942.50 | 2.15 |
| Sundaram Finance | 57,637.32 | 4.37 |
| Tata Capital | NA | NA |
Source: Screener. in
While the above were some of the major NBFCs in India, as said earlier also it is also a very fragmented market with many small numbers of players operating in it. They generally operate in niche segments, geography or product. Here is the non-exhaustive list:
Focus of some niche NBFCs
| Company | Lending Focus |
|---|---|
| SBI Cards | Engaged in issuing credit cards to consumers in India, which is very high yield product while cost of funds is low since its backed by SBI |
| Manappuram Finance | It is the 2nd-largest gold finance NBFC in India, specializing in offering credit against the security of used household gold jewelry. It also provides housing finance, loans against property, commercial vehicle finance, etc. |
| Capri Global | Capri Global is Gold loan NBFC with a focus on co-lending which basically means arranging the loans for banks and also co-lend into the same loan along with bank, simply put an asset light model |
| Ugro Capital | U GRO Capital limited is a technology-focused (data-centric & technology-enabled approach), small business lending platform. The company is focused on addressing the capital needs of small businesses operating in select eight sectors by providing customized loan solutions |
| Spandana Sphoorty | Spandana Sphoorty Financial is primarily engaged in the business of micro finance providing small value unsecured loans to low-income customers in semi-urban and rural areas. |
| Poonawalla Fincorp | It is engaged in providing consumer and MSME financing leverages technology to cater loan products at faster turn around time |
Navigating the NBFC landscape in FY25
The NBFC sector in FY2025 demonstrated significant resilience, successfully navigating regulatory challenges to emerge stronger. Among the large NBFCs, the analysis reveals a landscape of proven quality and strategic diversity. Industry behemoth Bajaj Finance continues to set the benchmark, leveraging its scale to deliver superior profitability metrics (RoA, RoE, NIM) that justify its premium market valuation.
About The Author
Next Story

