Upstox Originals
Is the future of work flexible?

10 min read | Updated on July 31, 2025, 15:30 IST


SUMMARY
The market for flexible workspaces in India is expanding quickly; in CY24, co-working accounted for ~10% of total office space, up from ~5% in CY19. Startups, independent contractors, businesses, and GCCs are driving demand, indicating a structural change in the way India operates. By 2027, the segment is anticipated to grow at a CAGR of ~20% almost at a 2x growth rate of the office stock rise.
In CY24 co-working accounted for ~10% of total office space, up from ~5% in CY19
A flexible workspace (often referred to as a co-working space) is a shared office where people from different companies work together. Due to their scalability, cost-effectiveness, and benefits for the employee experience, businesses are prioritising flexible workspaces.
Evolution of office space in India
Office space in India evolved from standalone buildings to integrated, flexible campus-style developments, driven by technology, startups, and corporate diversification.
| Phase | Space options | Demand drivers |
|---|---|---|
| Pre 2000 | Small standalone buildings, limited amenities, | Govt offices, banks, trade houses, private corporations |
| 2000–2008 | Campus-style, Grade A buildings with basic amenities, | Tech / engineering services, IT outsourcing, MNC expansion |
| 2009–2012 | Grade A campuses with better support, secondary standalone developments | IT / BPM growth, SEZs, biotech, enhanced services |
| 2013–2020 | Large integrated parks, green buildings, rise of flexible workspaces | MNCs, startups, local biz, demand for integrated/green spaces |
| 2021–Onwards | Multiple flexible workspace formats to suit varied needs | Return-to-office is becoming a key demand driver |
| Recent Trends | Tier II city expansion, tech-integrated campus focus | GCCs, MNCs, hybrid work, local demand, tenant diversification (R&D, e-com, startups) |
Source: Smartworks DRHP
Market size and outlook
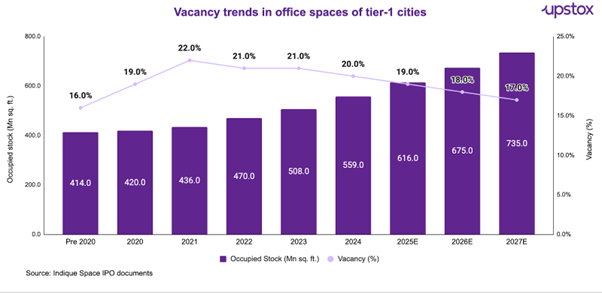
The commercial office market in India is witnessing a significant transformation, with flexible workspace solutions becoming an integral part of the modern work culture. It is around 9.5% of the total commercial office stock.
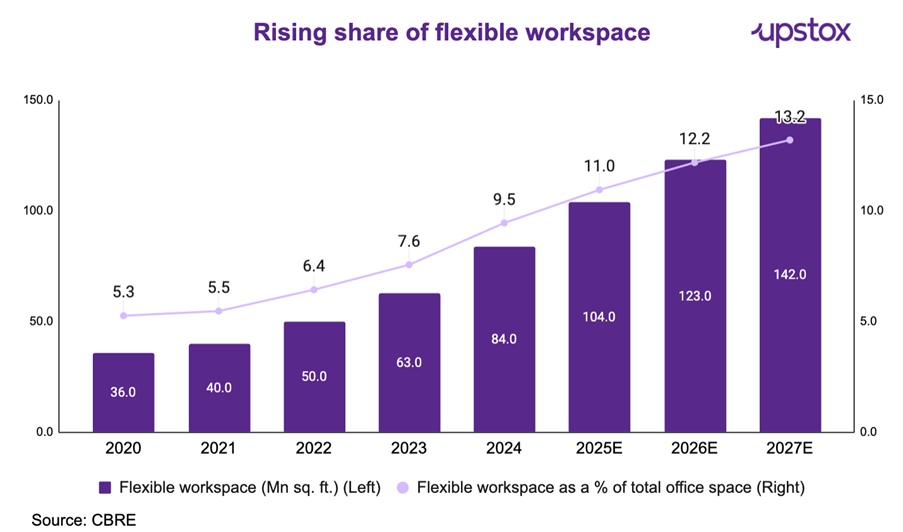
India's commercial office stock is estimated at 883 million square feet as of March 31, 2025, and is projected to grow to 1,072 million square feet by the end of 2027, at a CAGR of 6.7%. Out of which, the total flexible workspace stock is forecasted to grow from an ~82-86 million square feet by the end of CY2024 to ~140-144 million square feet across Tier 1 cities by the end of CY2027, with a CAGR of around 18-20%.
While this industry is assessed in terms of volumes (space in million sq ft) rather than value, the total addressable market of flexible office space in India is expected to grow from ~₹400 bn in 2024 to ~₹730 bn by 2027, with a CAGR of approximately 22.3% as per CBRE.
Key parameters of the real estate
The office space market is driven by three comprehensive parameters:
-
Absorption trends indicate how quickly vacant and newly available office spaces are being occupied in the real estate market.
-
Supply trends - Represents the total area of new floor space that has reached practical completion and is occupied, ready for occupation or an occupancy permit
-
The Vacancy trend is the % of available office space that is not occupied.
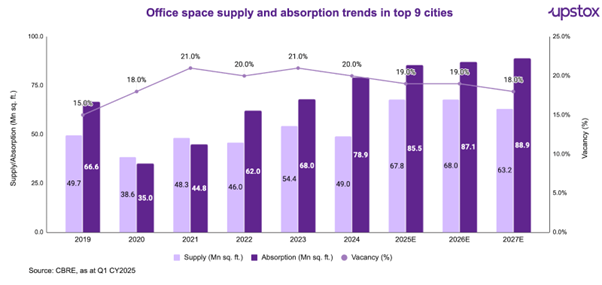
The office space market in India's top cities is shaped by absorption, supply, and vacancy trends. Absorption grew steadily until 2019, dipped in 2020 due to the pandemic, and rebounded strongly by 2023, nearing pre-pandemic levels, reflecting robust demand.
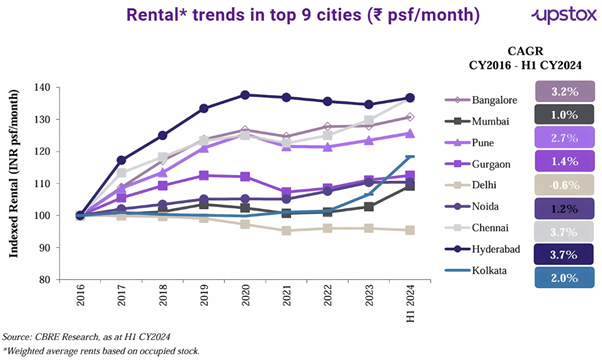
Rental Trends
Rental growth slowed during 2020–2021 but revived from 2022, with prime submarkets likely to see modest rent increases. These trends bode well for co-working spaces, as growing demand, stable vacancies, and flexible leasing needs align with their scalable, cost-effective, and community-driven offerings.
Vacancy Trends
Supply trends show new floor space completions aligning with occupancy needs, while vacancy rates have stabilised around the ~20% mark, showing some stability in the market.
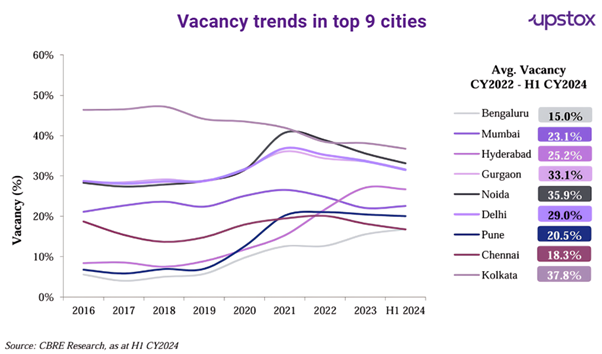
Overall vacancy trends are expected to come down with Tier 2 and Tier 3 emerging as major demand drivers and absorbers of new supply.
Key demand drivers
A combination of changing work habits, financial demands, technological advancements, and strategic real estate thinking is causing a structural revolution in the flexible workspace sector.
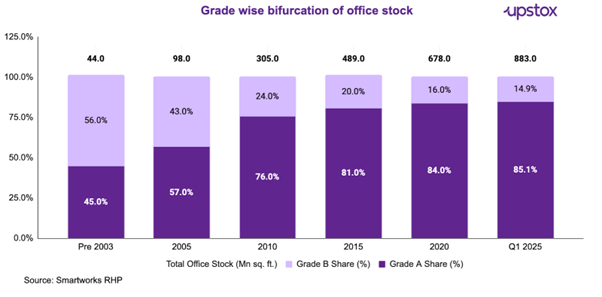
Rise of Grade A office spaces
For reference:
- Grade A: Refers to a development type characterised by tenant profiles that include prominent multinational corporations.
- Grade B: Refers to a development type where the tenant profile includes mid-to small-sized corporations.
Rise of Global Capability Centres (GCCs)
India's GCC boom, with 1,900+ centres by FY24, drives demand for flexible workspaces. Multinational offshore units leverage India's talent and cost benefits, needing secure, tech-integrated offices. Flexible workspace operators offer managed campuses with tailored IT and access control for quick GCC setups.
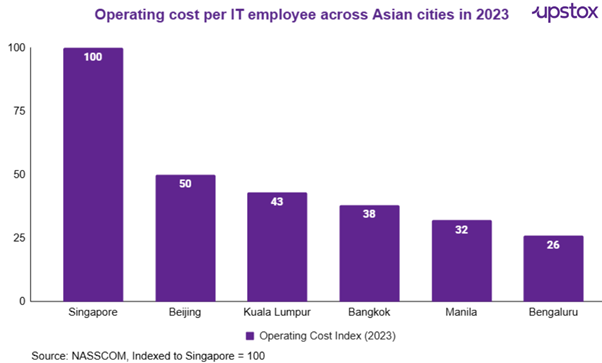
India is also very cost-competitive. Take Bengaluru as an example. In 2023, its operating cost per employee for IT services in 2023 is, on average, 65% cheaper than other cities making it an attractive, cost-effective option for companies looking to optimise real estate expenditures.
Startup economy boom
India's startup ecosystem, with 100+ unicorns and 115,000 DPIIT-recognised startups, drives demand for flexible workspaces. Early-stage startups favor affordable, serviced offices to focus on growth without real estate hassles. Flexible workspaces offer dynamic, talent-attracting environments. The growing gig and freelance economy, including consultants, developers, and marketers, seeks professional, community-driven spaces.
Institutional backing and sector formalisation
The industry has grown up and become more organised over time. Private equity, venture capital, and real estate investment trusts (REITs) support the top operators, making operations professional and making it possible to invest in design and technology.
| Company Name | Backed by |
|---|---|
| Awfis Spaces | ChrysCapital |
| WeWork India | Embassy Group |
| Smartworks | Keppel Land |
| IndiQube | WestBridge Capital |
Flexible workspaces offer multiple benefits:
-
Capital Efficiency: Operators fund facility costs, freeing capital for core activities.
-
Operational Outsourcing: A single vendor handles real estate tasks, preserving business focus.
-
Flexibility: Contracts allow adjustments in space, location, or pricing.
-
Variety: Offerings include on-demand spaces, meeting rooms, private suites, and managed offices.
-
Customisation: Managed offices offer bespoke, private workspaces.
-
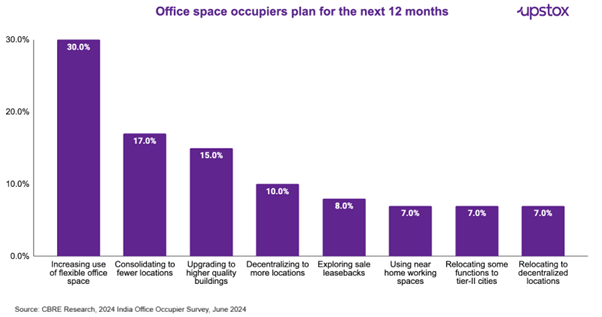
Employee Experience: Co-working spaces boost creativity and wellness with open layouts, natural light, ergonomic furniture, and amenities like cafes and lounges. In India, 86% of occupiers plan high-quality leases within two years, showing demand for premium offices.
-
Enhanced flexibility, cost efficiency, and convenience for businesses, with rapid scalability and tailored solutions.
Reflecting this trend, about 30% of occupiers identified “expanding their use of flexible office spaces” as their primary portfolio strategy. Over the next 12 months. While companies across sectors indicated increased usage of flexible workspaces, domestic occupiers indicated a higher preference compared to American corporates.
Geographical landscape of flexible office spaces
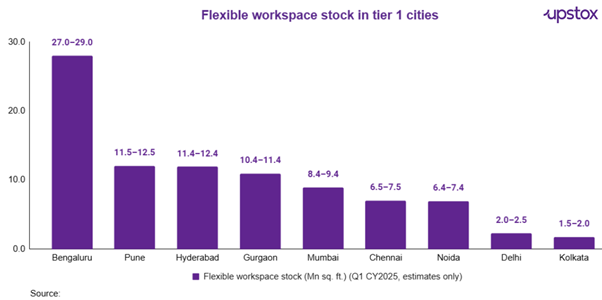
90% of the flexible office space is in Tier-1 cities, with Bengaluru being the largest market, while Pune and Hyderabad are emerging as the fastest-growing markets.
While non-tier 1 cities are also emerging as potential geographical locations for flexible workspaces
Cities such as Ahmedabad, Kochi, Vadodara, Coimbatore, Jaipur, and Indore have seen growth in multi-tenanted buildings (MTB) over the past few years. This growth is driven by the availability of land parcels, competitive rentals, developing infrastructure and connectivity, the presence of manufacturing hubs, service hubs and access to skilled talent.
| Particulars | Ahmedabad | Indore | Jaipur | Coimbatore |
|---|---|---|---|---|
| Regulatory Framework | Gujarat IT/ITeS Policy (2022–2027), Industrial Policy (2020–2025) | Madhya Pradesh IT Policy (2019), Startup Policy 2022, MSME Policy 2021 | Rajasthan IT/ITeS Policy (2015–2025), Startup & Innovation Policy (2019–2026) | Tamil Nadu Information Communication Policy (2018), Startup Policy (2018–2023) |
| Connectivity (Airport) | Sardar Vallabhbhai Patel International Airport | DAHB International Airport | Jaipur International Airport | Coimbatore International Airport |
| Prominent Colleges | IIM Ahmedabad, MICA, Nirma University, CEPT | IIT Indore, IIM Indore, The Institute of Engineering & Technology | Malviya National Institute of Technology, Manipal University | PSG College of Arts & Science, Coimbatore Institute of Technology |
| Prominent Office Spaces | GIFT City, Mindspace Gandhinagar, Hiranandani Signature | Brilliant Sapphire, C21 Business Park, Skye Corporate Park | Mahindra World SEZ, World Trade Park, Jaipur Centre, Mangalam Signature Tower | Hanudev Infopark, KCT Tech Park, TIDEL Park, SVB Tech Park |
Source: CBRE, Smartworks RHP
Peer Comparison
Operational Parameters (as of March 2024)
Smartworks leads in terms of total area and the number of seats, highlighting its larger presence in the market. Awfis, on the other hand, operates in most cities, demonstrating its broad geographic reach. IndiQube stands out with the highest occupancy rate for mature centres, indicating strong demand for its spaces. In terms of client loyalty, Smartworks and IndiQube dominate with the longest average client-side tenure, suggesting a more stable and long-term client base compared to others.
| Parameters | WeWork India | Smartworks | IndiQube | Awfis |
|---|---|---|---|---|
| Total Stock/Area (Mn. sq. ft.) | 6.6 | 8.0 | 5.5 | 5.6 |
| Total No. of Cities | 8 | 13 | 12 | 17 |
| Total No. of Centres | 53 | 41 | 85 | 181 |
| Total Seats | 93,786 | 1,82,228 | 1,18,530 | 1,10,540 |
| Occupancy for Mature Centres (>12 months) | 85.6% | 86.8% | 90.1% | 84.0% |
| Weighted Average Tenure – Client Side (months) | 23 | 46 | 46 | 33 |
Source: IndiaQube RHP; Note: Data as of March-24 since most of the companies are private.
Financial Parameters (FY23–24)
WeWork India stands out with the highest annual revenue and rental revenue, reflecting its dominant market position. Smartworks, while trailing in revenue, excels in profitability with the highest EBITDA margin, suggesting better cost efficiency and profitability.
In terms of occupancy rates, WeWork India leads with 82.04%, while Awfis has the lowest at 71%. Smartworks also has the highest seat retention rate, indicating stronger client retention compared to the others. Despite this, Awfis and IndiQube show a more modest EBITDA margin, highlighting the varying operational efficiency across the companies.
| Parameters | WeWork India | Smartworks | IndiQube | Awfis |
|---|---|---|---|---|
| Total Revenue (₹ Crore) | 1,737.2 | 1,113.1 | 868.0 | 875.0 |
| Annual EBITDA (₹ Crore) | 1043.8 | 659.7 | 226.3 | 271.4 |
| EBITDA Margin (%) | 63.5% | 62.7% | 32.0% | 27.3% |
| Occupancy Rate (%) | 82.0% | 80.0% | 80.2% | 71.0% |
| Seats Retention Rate (%) | 76.0% | 88.0% | NA | NA |
Source: IndiaQube RHP' Note: Since most companies are private, data for FY25 is not available, and FY24 data is being considered.
Potential Threats and Challenges:
The flexible workspace sector faces risks
-
Economic uncertainty: Downturns like COVID-19 reduce workspace demand.
-
Supply constraints: Limited properties delay expansion.
-
Concentration risk: Dependence on few clients risks revenue.
-
Market saturation: Oversupply increases competition, lowers prices.
-
Operational risks: Fluctuating occupancy and costs hurt profits.
-
Client churn: Downturns cause vacancies, cash flow issues.
-
Rent variations: Changing lease costs affect profitability.
-
Asset-Liability mismatch: Long-term leases vs. short-term clients create financial risk.
Final thoughts
The flexible workspace industry in India has grown from a niche solution for freelancers and startups to a mainstream real estate model that is ready for businesses and meets the needs of modern work. They are essential to both new and established businesses because they can provide scalable infrastructure, bundled services, and design that puts employees first.
About The Author
Next Story

