Upstox Originals
Is the bottom near? Market breadth may hold the clue

6 min read | Updated on March 24, 2025, 15:23 IST


SUMMARY
A common question on every investor’s mind right now – when do we see the light at the end of the tunnel. Encouragingly, a critical market breadth indicator, is not only pointing to a potential bottom but also a recovery. In this article, we explore how market breadhth indicators can help you significantly mitigating portfolio risk and protect your investments.

Market breadth indicators can help mitigate portfolio risk
One common misnomner about technical analysis is – it helps takes action only after an event has occurred. So for example – only after a stock has breached its moving average or a candle stick has completed a particular pattern – is it useful!
In this article, we look at one of the most useful yet underutilsied indicator that can help investors and trader alike in potentially anticipating future market movements.
What is market breadth?
Market breadth is a technical measure that reflects the underlying strength or weakness in stock market movements by analysing how widely stocks participate in a trend.
Here is a simple example using a cricketing analogy. Suppose a team wins the match, with only one player scoring 200 runs and the rest of the team barely contirbting. While the team has technically won, is it really a strong team? Versus that, if all 11 players contribute equally, the team can be counted as a strong one.
Similarly market breadth measures the strength of the market movement. Unlike frontline indices such as Nifty 50, which are dominated by large-cap stocks, examining breadth through broader indices like Nifty 500 provides deeper and more accurate insights into market health.
Think about it, how many times have you read headlines which read something like – Markets rise, driven by three stocks or vice versa!
Looking at the Nifty500, which has a much larger collection of stocks, helps overcome this challenge.
By assessing metrics like the advance-decline ratio or the percentage of stocks above key moving averages, investors can gauge if a market trend is broadly supported or driven by just a few stocks.
Why is this critical?
Analysing breadth through a wider index such as the Nifty 500 is especially valuable at market turning points.
As with many technical indicators, looking at just the movement in the indicator will not provide the whole picture, one must look out for divergence. In technical terms, a divergence means when two connected parameters don’t move in the same direction, basically indicating a shift in market perception.
Divergences—where the index price moves higher but breadth indicators weaken—often precede corrections or reversals.
Advance-decline line: An early indicator of shift in trend
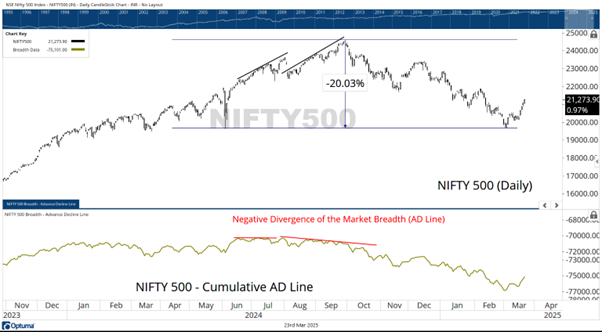
The broader Nifty 500 Index recently experienced a significant correction of about 20%, declining from its peak of 24,573 recorded in September last year to a potential bottom near 19,681 earlier this month.
Such notable market moves naturally prompt the question—was it possible to foresee this correction ahead of time? A closer look at the cumulative Advance-Decline Line (AD Line), a critical breadth indicator, reveals clear signs of weakening market participation that hinted at potential trouble well before the actual decline materialised.
The cumulative AD Line provides deeper insights by continuously summing the net difference between advancing and declining stocks each trading day. Unlike a standalone index, which can sometimes be driven upward by just a handful of large-cap stocks, the AD Line captures the underlying health and broader participation of stocks across various market caps and sectors.
-
A rising AD Line generally indicates broad-based bullish momentum and sustainable strength.
-
Conversely, a flattening or declining AD Line, especially when the broader index climbs higher, indicates deteriorating internal strength and narrowing market leadership.
Negative divergences between price action and breadth indicators like the AD Line frequently serve as early warnings of potential market reversals. Such divergences occur when the index continues to make higher highs, but the AD Line forms lower highs, reflecting diminishing participation beneath the surface. This condition typically suggests that fewer stocks are contributing meaningfully to the rally, which is often characteristic of a weakening bullish trend approaching exhaustion.
This scenario precisely unfolded in the Nifty 500 Index from June to September last year. While the index itself continued advancing, repeatedly setting new peaks, the cumulative AD Line distinctly formed lower highs, failing to confirm the index's optimism. This clear negative divergence strongly indicated weakening breadth, highlighting that fewer stocks were sustaining the rally—an early symptom of an approaching reversal.
Historically, such divergences have reliably predicted meaningful corrections. Investors who recognised and interpreted these signals appropriately could have proactively managed their portfolios by reducing exposure, initiating hedges, or adopting defensive strategies ahead of the subsequent 20% correction, significantly mitigating portfolio risk and enhancing investment outcomes.
Percent of stocks above 200-week MA: Signaling potential market bottoms
While the recent decline in the Nifty 500 raised concerns, another key market breadth indicator—the percentage of stocks above their 200-week moving average (MA)—is hinting at a potential market bottom near the recent lows of 19,681.
Simultaneously, the frontline Nifty 50 index has rebounded from its critical support at the 100-week MA, currently positioned around 22,005, further strengthening the case for a near-term stabilisation.
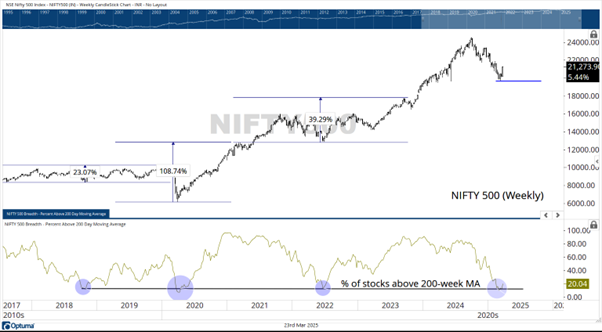
Historically, the percentage of stocks above the 200-week MA has been highly effective in signaling major market bottoms. Whenever this indicator has reached lows between 10% and 12%, it has consistently preceded meaningful market recoveries.
For instance, when this breadth measure fell to these levels in October 2018, March 2020, and June 2022, the Nifty 500 subsequently recorded substantial rallies of approximately 23%, 108%, and 39%, respectively. These market upmoves typically began when the indicator dipped to these extreme lows and continued until it eventually showed negative divergence.
During the recent corrective phase at the beginning of this month, this indicator again reached the crucial 10%-12% threshold. Given its historically reliable track record, this occurrence significantly enhances the probability that the recent bottom near 19,681 could hold for the foreseeable future. Consequently, the current breadth conditions suggest an increased likelihood of the broader market experiencing a sustained and meaningful upward trajectory from these lows.
What does this mean?
Considering the argument presented above, we believe that these two critical market breadth signals could have some good news. At current levels, lows are likely to hold (meaning, limited fall in markets from here), and even more encouragingly, markets could even recover going ahead.
Considering the current breadth conditions, including the percentage of stocks above their 200-week moving average reaching historically critical levels, the likelihood of the recent lows holding appears notably strong. Specifically, the broader Nifty 500 Index's bottom near 19,681 and the Nifty 50's rebound from its significant 100-week moving average support at 22,005 collectively strengthen this optimistic outlook.
Historically, similar conditions have reliably predicted sustained recoveries, providing investors with compelling evidence to anticipate a meaningful upside from these levels. While vigilance remains important, the underlying breadth signals clearly suggest brighter prospects ahead, indicating that the worst of the correction may now be behind us, laying the foundation for renewed market strength.
About The Author
Next Story

